

ATI (ATI), Why Is It Getting Fresh Attention Today?
ATI Inc ATI | 0.00 |
ATI (ATI) is back in focus after being highlighted for recent price strength and strong analyst ratings, including a top Zacks Rank supported by upward earnings estimate revisions and a positive consensus view.
The recent pullback, with a 1-day share price return of 1.10% and a 7-day share price return of 1.45%, comes after a strong 30-day share price return of 10.5% and a 90-day share price return of 24.82%. ATI’s 1-year total shareholder return of 177.31% and very large 5-year total shareholder return suggest momentum has been strong over both shorter and longer periods.
Scan for more stocks showing similar price momentum and earnings support as ATI by checking our hand picked 20 high quality undiscovered gems today.
ATI appears to be a strong specialty materials business, supported by positive analyst sentiment and solid recent returns. After this kind of run, the real test is whether the current share price still offers clear value.
Most Popular Narrative: 6.3% Overvalued
ATI last closed at $212.86, while the most widely followed narrative anchors fair value at $200.33. The gap comes from how future growth and margins are framed.
Analysts are assuming ATI's revenue will grow by 8.9% annually over the next 3 years. Analysts assume that profit margins will increase from 9.3% today to 14.7% in 3 years time.
Read the complete narrative. Read the complete narrative.
Want to see what turns those revenue and margin paths into a higher fair value for ATI? The narrative leans on a step change in profitability, a richer earnings multiple, and a detailed timeline for when those gains show up in the numbers.
Result: Fair Value of $200.33 (OVERVALUED)
However, ATI's reliance on a small group of major aerospace customers, along with ongoing heavy capital spending, could quickly challenge this narrative if orders or execution disappoint.
Another View on ATI Using Earnings Multiples
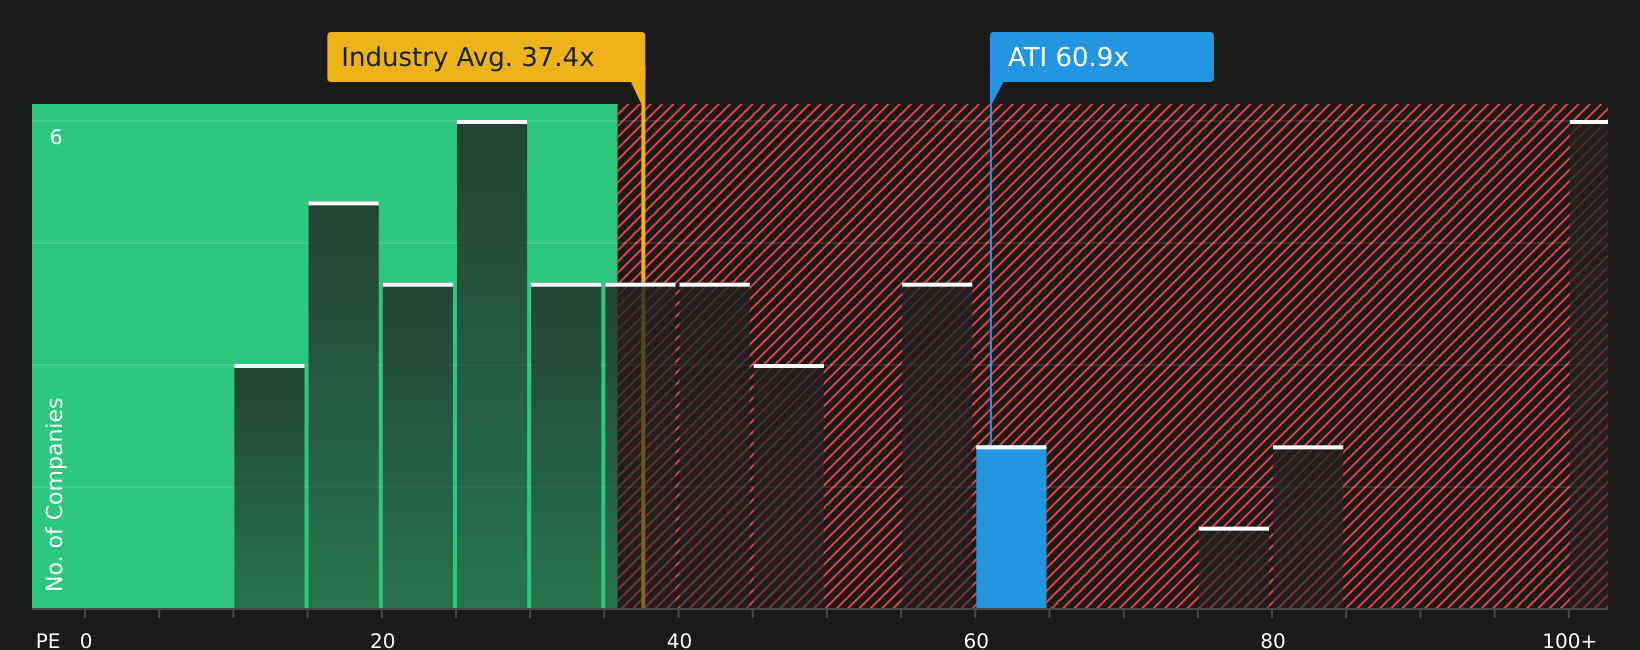
The earlier narrative framed ATI as 6.3% overvalued relative to a $200.33 fair value anchored to analyst forecasts. On simple earnings multiples the story is more mixed. ATI trades on a P/E of 60.9x, which is lower than the peer average of 75x, yet well above an estimated fair ratio of 35.4x that the market could move toward over time. That combination points to rich pricing even against a strong earnings profile and leaves you asking whether current optimism already prices in much of the expected growth.
For a closer look at how this earnings based view stacks up against other approaches, including detailed ratio work, review the valuation breakdown and how the current multiple compares across the sector: See what the numbers say about this price — find out in our valuation breakdown.
Next Steps
Given the mix of optimism and concern around ATI, it makes sense to move quickly, review the key data, and decide where you stand. To weigh up both sides in one place, check the 2 key rewards and 1 important warning sign.
Looking for more ideas beyond ATI?
If ATI has your attention, do not stop here. Broaden your watchlist now so you are not relying on just one opportunity.
- Target potential value opportunities by scanning our 51 high quality undervalued stocks and see which stocks currently line up with your expectations.
- Strengthen your downside protection by reviewing a list of solid balance sheet and fundamentals (51 results) and focus on companies with sturdier financial footing.
- Reduce potential shocks by checking a 75 resilient stocks with low risk scores that highlights stocks with lower overall risk profiles.
This article by Simply Wall St is general in nature. We provide commentary based on historical data and analyst forecasts only using an unbiased methodology and our articles are not intended to be financial advice. It does not constitute a recommendation to buy or sell any stock, and does not take account of your objectives, or your financial situation. We aim to bring you long-term focused analysis driven by fundamental data. Note that our analysis may not factor in the latest price-sensitive company announcements or qualitative material. Simply Wall St has no position in any stocks mentioned.