

Atlanticus Holdings (ATLC) Faces A Valuation Test On Russell Index Removal
Atlanticus Holdings Corp. ATLC | 0.00 |
Atlanticus Holdings (ATLC) has been removed from several Russell value indexes, including the Russell 2000 Value and Russell 3000 Value benchmarks. This index reshuffle can influence fund ownership patterns and trading liquidity.
Despite the index removals, Atlanticus Holdings has seen strong momentum over the past few months, with a 30 day share price return of 15.79% and a 90 day share price return of 60.27%, while the 1 year total shareholder return stands at 70.90%.
If this index reshuffle has you thinking about where else capital is moving, it could be a good moment to broaden your search and check out 19 top founder-led companies
After a sharp run in Atlanticus Holdings despite its removal from multiple Russell value indexes, the key question now is simple: does the current price still offer an appealing trade-off between risk and potential reward, or has most of the upside already been reflected?
Most Popular Narrative: 6.4% Undervalued
With Atlanticus Holdings closing at $97.38 against a narrative fair value of $104.00, the current setup depends on how its lending platform scales from here.
The acquisition and integration of Mercury Financial has roughly doubled the balance sheet to about US$7b and brought a US$3b portfolio under Atlanticus portfolio management methods. Management expects this to support higher yields and return on assets over time, directly influencing revenue and earnings.
Big balance sheet shift. Bold growth targets. Margin pressure is incorporated into the model, yet the analysis still points to higher earnings power. Curious which assumptions really drive that $104 fair value estimate?
Result: Fair Value of $104 (UNDERVALUED)
However, Atlanticus Holdings still faces key pressure points, including higher funding costs if credit markets tighten and the risk that Mercury integration savings will arrive more slowly than planned.
Another View: SWS DCF Model Flags Overvaluation
While the narrative fair value for Atlanticus Holdings lands at $104, the SWS DCF model paints a sharper contrast. On this measure, the stock at $97.38 sits well above an estimated future cash flow value of $54.99, which frames Atlanticus Holdings as overvalued on cash flow assumptions.
That gap raises an important question for investors: which set of assumptions feels more realistic for how Atlanticus Holdings can turn forecast growth into long term cash generation, and which risks matter most to you right now?
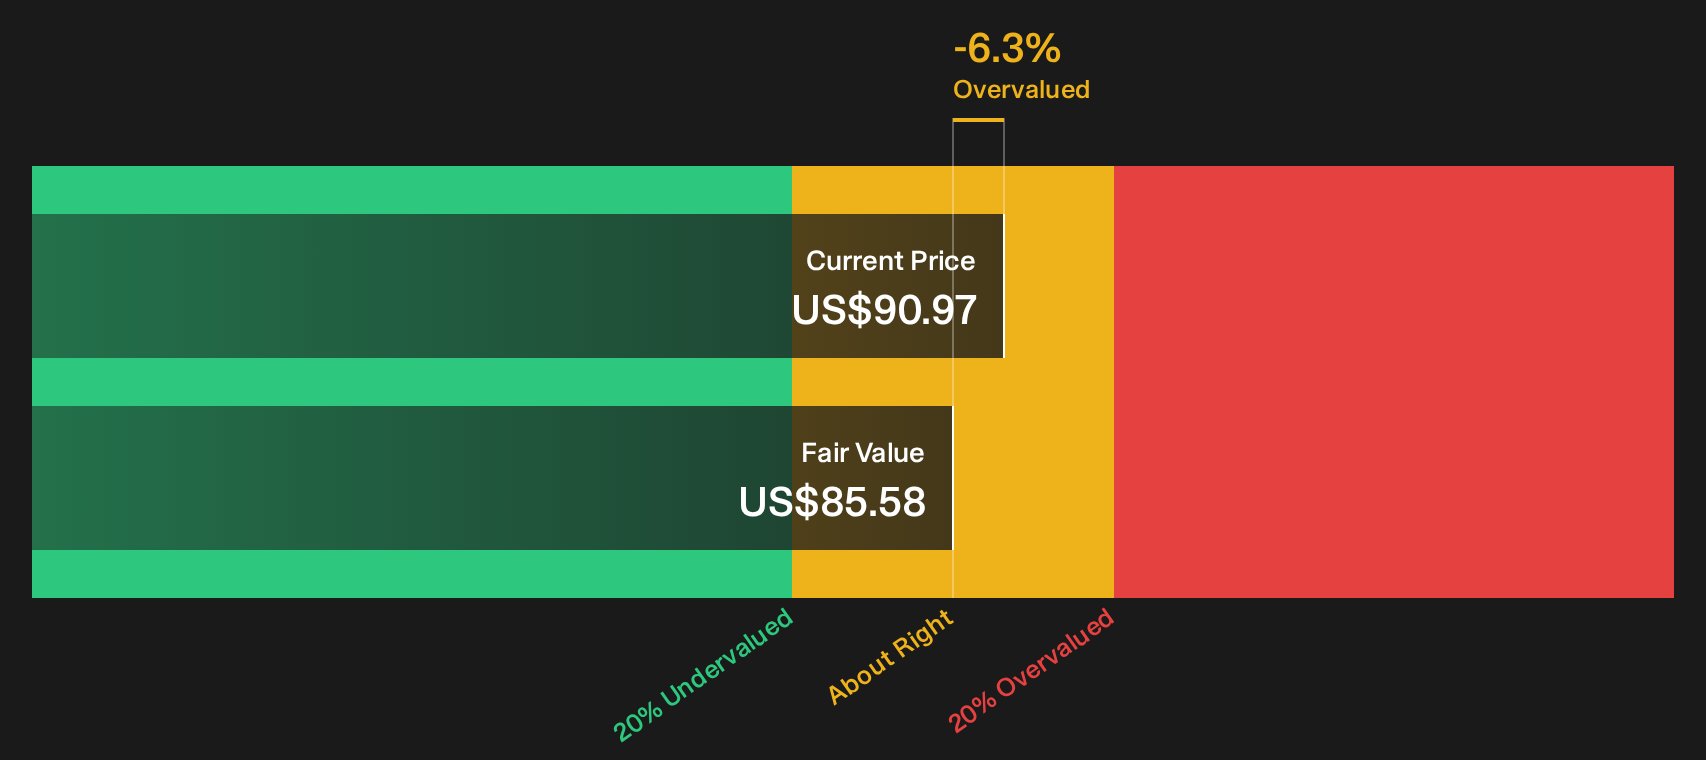
Simply Wall St performs a discounted cash flow (DCF) on every stock in the world every day (check out Atlanticus Holdings for example). We show the entire calculation in full. You can track the result in your watchlist or portfolio and be alerted when this changes, or use our stock screener to discover 45 high quality undervalued stocks. If you save a screener we even alert you when new companies match - so you never miss a potential opportunity.
Next Steps
With mixed signals on valuation and sentiment around Atlanticus Holdings, do you want to rely on others, or review the data yourself and move quickly to form your own view using 3 key rewards and 2 important warning signs?
Looking for more investment ideas beyond Atlanticus Holdings?
If the valuation debate around Atlanticus Holdings has sharpened your thinking, do not stop here. Broaden your watchlist and let high quality screens guide your next move.
- Zero in on value by scanning companies that combine quality fundamentals with discounted prices using 45 high quality undervalued stocks.
- Strengthen your search for resilience by focusing on businesses with robust finances through the solid balance sheet and fundamentals stocks screener (47 results).
- Get ahead of the crowd by tracking potential future standouts with the screener containing 18 high quality undiscovered gems.
This article by Simply Wall St is general in nature. We provide commentary based on historical data and analyst forecasts only using an unbiased methodology and our articles are not intended to be financial advice. It does not constitute a recommendation to buy or sell any stock, and does not take account of your objectives, or your financial situation. We aim to bring you long-term focused analysis driven by fundamental data. Note that our analysis may not factor in the latest price-sensitive company announcements or qualitative material. Simply Wall St has no position in any stocks mentioned.