Badger Meter (BMI) Margin Stability At 15.5% Tests Bullish Earnings Momentum Narratives
Badger Meter, Inc. BMI | 156.73 | +1.63% |
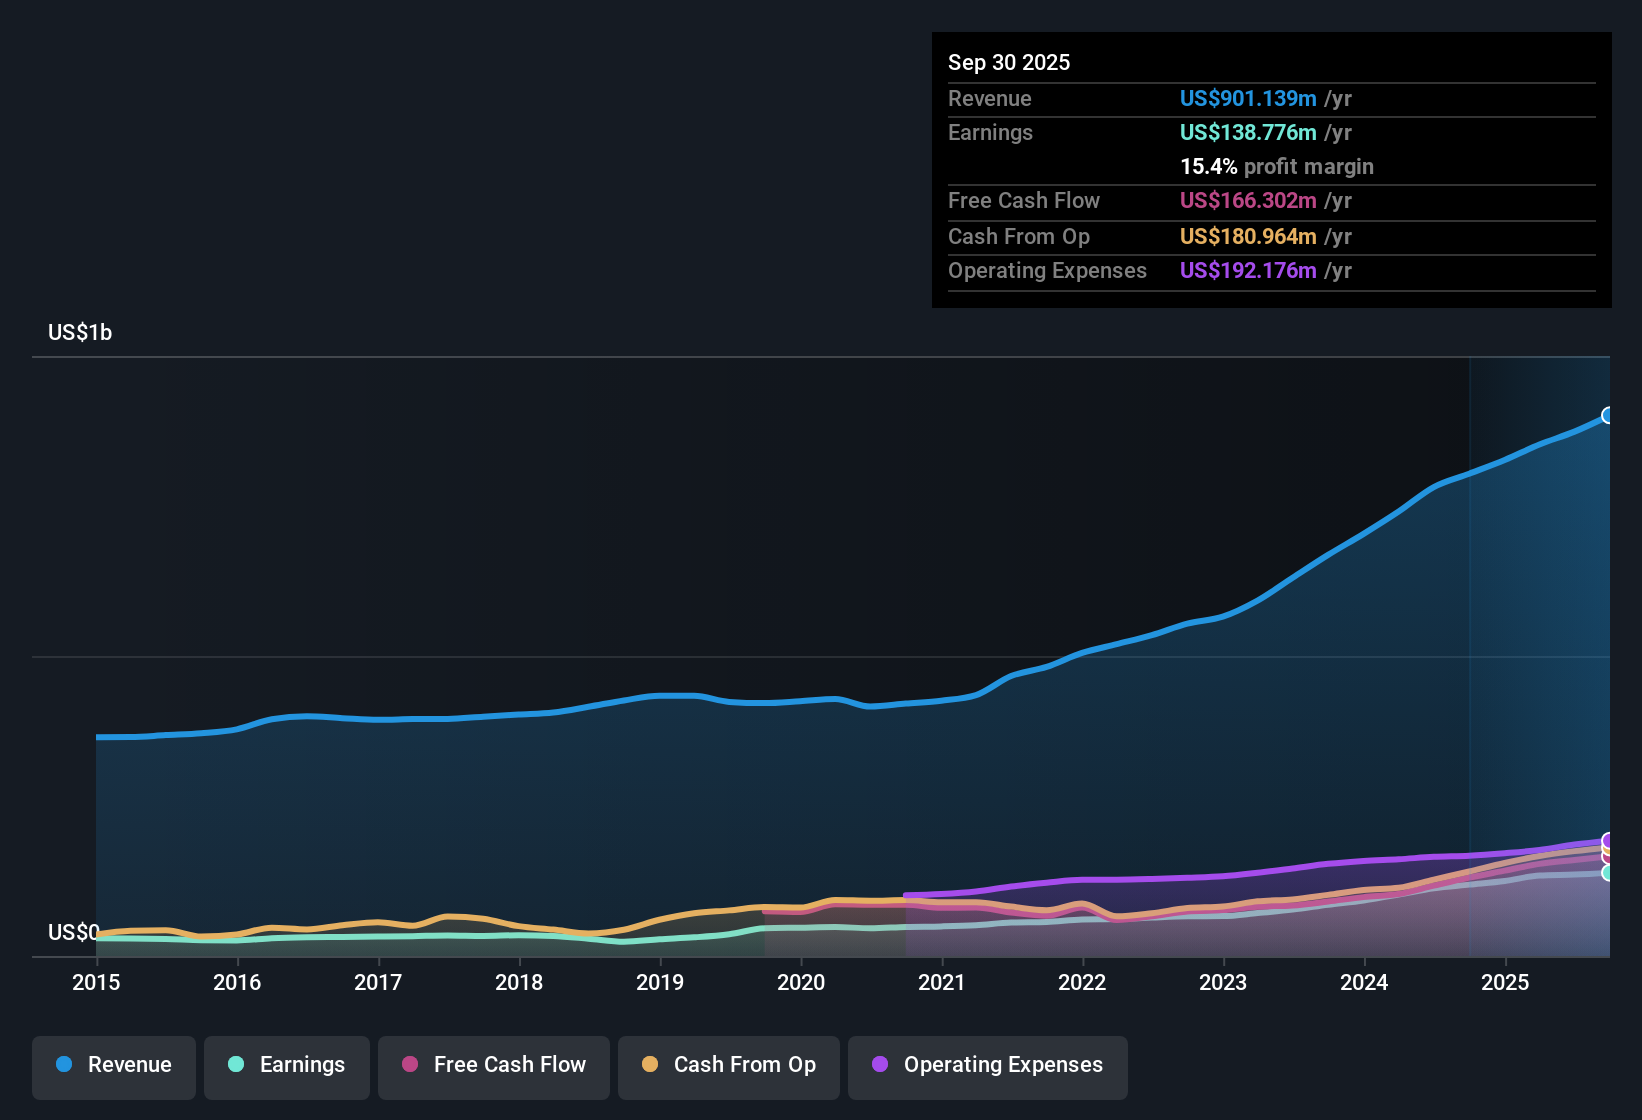
Badger Meter (BMI) closed out FY 2025 with fourth quarter revenue of US$220.7 million and basic EPS of US$1.14, alongside net income of US$33.6 million. On a trailing twelve month basis, revenue was US$916.7 million with EPS of US$4.82 and net income of US$141.6 million. The company reported quarterly revenue increasing from US$205.2 million in Q4 2024 to US$220.7 million in Q4 2025, and basic EPS rising from US$1.05 to US$1.14 over the same period. This sets up the latest report as a check in on how its profit base is feeding through to margins.
See our full analysis for Badger Meter.With the headline numbers on the table, the next step is to see how this earnings profile compares with the growth and risk narratives that have developed around the stock over the past year.
Margins Hold Steady Around 15.5%
- On a trailing 12 month basis, net income of US$141.6 million on US$916.7 million of revenue works out to a net margin of about 15.5%, compared with 15.1% a year earlier.
- Supporters of a bullish view point to this margin stability as a sign of earnings quality, yet the trailing 12 month earnings growth rate of 13.4% sits below the 23% per year five year average. This means:
- The current margin level aligns with the idea of a solid profit base, but it also reflects growth that is already slower than the longer term trend.
- This mix of high margin and moderating growth gives bulls both a strength to highlight and a data point that asks whether past profit momentum is repeating.
Five Year EPS Growth vs 13.4% LTM
- Earnings expanded about 23% per year over the last five years, while the latest 12 month period came in at 13.4% earnings growth, which is clearly lower than that longer run pace.
- Critics with a bearish tilt focus on this gap, arguing that slower 13.4% growth plus forecasts of about 10.07% annual earnings growth and 7.8% annual revenue growth, both below the referenced broader US market rates, could cap enthusiasm, because:
- The difference between 23% historical growth and 13.4% most recent growth is exactly what they point to when they say momentum has cooled compared with the past.
- The fact that forecast growth rates sit below the cited US market expectations reinforces the idea that the future may look more moderate than the prior five year stretch.
P/E Of 30.4x And DCF Fair Value
- The shares trade on a P/E of 30.4x, compared with 27.2x for the wider US Electronic industry and 38.7x for a specified peer group, while a DCF fair value of about US$151.26 sits roughly 3.3% above the current US$146.32 share price.
- What stands out for a more bullish camp is that the stock is described as trading slightly below that DCF fair value and below the peer P/E multiple, even though its P/E is higher than the broader industry. They argue:
- The small gap between US$151.26 DCF fair value and the US$146.32 market price is consistent with a view that the shares are not pricing in aggressive assumptions.
- The contrast between a 30.4x P/E that is under the 38.7x peer level but above the 27.2x industry average is used to frame the valuation as reflecting its earnings record without pushing it to the very top of the peer range.
Next Steps
Don't just look at this quarter; the real story is in the long-term trend. We've done an in-depth analysis on Badger Meter's growth and its valuation to see if today's price is a bargain. Add the company to your watchlist or portfolio now so you don't miss the next big move.
See What Else Is Out There
Badger Meter’s most recent 13.4% earnings growth, which trails its 23% five year pace along with moderated forecasts, suggests momentum is cooler than its past trajectory.
If you want stocks where growth looks steadier across cycles, use our stable growth stocks screener (2166 results) to quickly zero in on companies with more consistent earnings trends.
This article by Simply Wall St is general in nature. We provide commentary based on historical data and analyst forecasts only using an unbiased methodology and our articles are not intended to be financial advice. It does not constitute a recommendation to buy or sell any stock, and does not take account of your objectives, or your financial situation. We aim to bring you long-term focused analysis driven by fundamental data. Note that our analysis may not factor in the latest price-sensitive company announcements or qualitative material. Simply Wall St has no position in any stocks mentioned.