

Berkshire Hathaway (BRK.B) Could Be 36% Undervalued After Trump Disclosure Raises Fresh Valuation Questions
Berkshire Hathaway Inc. Class B BRK.B | 0.00 |
President Donald Trump’s June financial disclosure, detailing more than 1,000 securities trades and sizeable purchases of Berkshire Hathaway (BRK.B), has refocused attention on the conglomerate’s stock and its role in diversified portfolios.
Berkshire Hathaway’s share price has been steady in recent weeks, with the stock at US$495.82 after a small dip over the past day. Longer term total shareholder returns of 39.45% over three years and 73.57% over five years point to persistent investor interest despite short term swings and headlines such as Trump’s recent buying and Berkshire’s increased stake in Alphabet.
If Trump’s trades have you thinking about what other opportunities might be out there, it could be a good moment to scan the market for 20 top founder-led companies
Berkshire Hathaway looks like a robust business, backed by a large mix of insurance, rail and energy operations. After Trump’s recent buying and a share price near US$496, investors may ask whether that strength is already fully reflected in today’s valuation.
Preferred P/E of 12.4x for Berkshire Hathaway: Is it justified?
Based on the latest data, Berkshire Hathaway trades on a P/E of 12.4x, and the stock is described as trading at good value compared to peers at a last close of $495.82.
The P/E ratio compares the current share price with earnings per share, so it reflects how much investors are paying today for each dollar of current earnings. For a diversified financial conglomerate such as Berkshire Hathaway, which has large insurance, rail and energy operations, this is a commonly watched gauge of how the market values its earnings profile.
Here, Berkshire Hathaway’s current P/E of 12.4x is assessed as good value relative to an estimated fair P/E of 16.5x. This suggests the market price is below the level the SWS fair ratio model points to as reasonable. The same 12.4x P/E is also described as good value versus the US Diversified Financial industry average of 17.9x and a peer average of 23.7x, which is a wide gap that implies the market is applying a lower earnings multiple than those benchmarks.
Result: Price-to-Earnings of 12.4x (UNDERVALUED)
However, Berkshire Hathaway’s recent decline in annual net income, together with softer short term share returns, could challenge the idea that its current P/E offers a clear bargain.
Another View on Berkshire Hathaway’s Valuation
The SWS DCF model paints a stronger picture for Berkshire Hathaway than the current P/E suggests. At a share price of $495.82, the stock is described as trading below an estimated future cash flow value of $786.06, which implies a wide margin between price and modeled value. How comfortable are you with relying on long term cash flow assumptions instead of today’s earnings multiple?
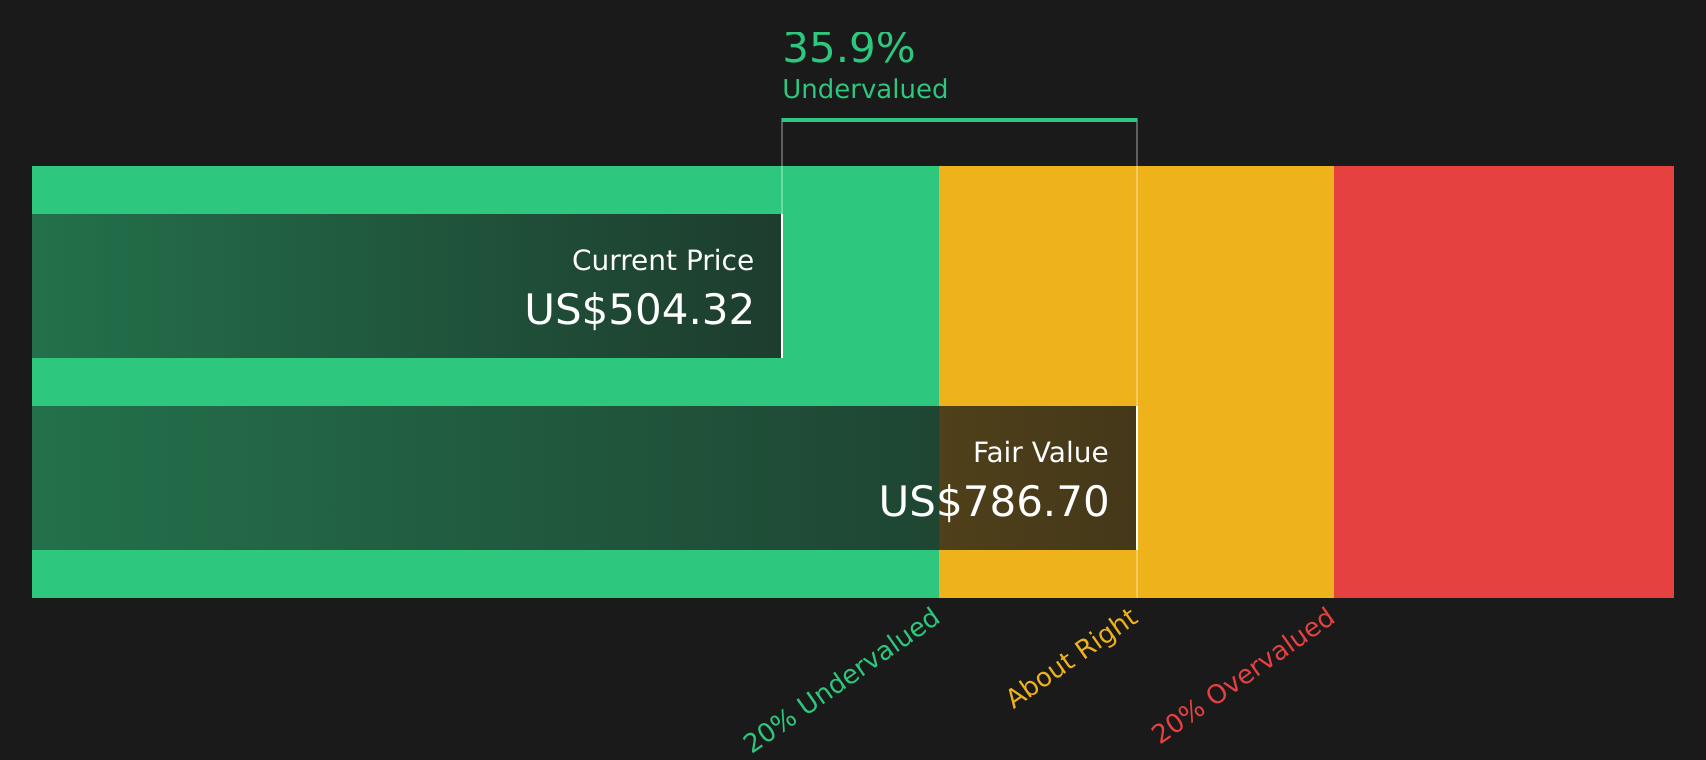
Simply Wall St performs a discounted cash flow (DCF) on every stock in the world every day (check out Berkshire Hathaway for example). We show the entire calculation in full. You can track the result in your watchlist or portfolio and be alerted when this changes, or use our stock screener to discover 48 high quality undervalued stocks. If you save a screener we even alert you when new companies match - so you never miss a potential opportunity.
Next Steps
Given the mix of concerns and optimism around Berkshire Hathaway, it makes sense to look past the headlines and inspect the details yourself. To help frame that view, take a closer look at the 3 key rewards and 1 important warning sign.
Looking for more investment ideas beyond Berkshire Hathaway?
If Berkshire Hathaway has sharpened your focus, now is the time to widen your watchlist with a few focused screens built to surface fresh ideas.
- Target resilient ideas that aim to protect your capital by starting with 75 resilient stocks with low risk scores.
- Hunt for quality at a reasonable price by reviewing the 48 high quality undervalued stocks.
- Spot potential early stage opportunities before the crowd by checking out the 22 elite penny stocks with strong financials.
This article by Simply Wall St is general in nature. We provide commentary based on historical data and analyst forecasts only using an unbiased methodology and our articles are not intended to be financial advice. It does not constitute a recommendation to buy or sell any stock, and does not take account of your objectives, or your financial situation. We aim to bring you long-term focused analysis driven by fundamental data. Note that our analysis may not factor in the latest price-sensitive company announcements or qualitative material. Simply Wall St has no position in any stocks mentioned.