

BGC Group (BGC), Why Is This Latest Update Drawing Attention?
BGC Group, Inc. Class A BGC | 0.00 |
BGC Group (BGC) recently expanded its long-running relationship with IPC Systems by selecting the IPC One communications and connectivity platform, a move intended to streamline operations and improve broker and trader workflows.
That move comes as BGC Group’s share price has risen 35.35% year to date, with shorter term momentum also firming on a 15.79% 90 day share price return. The 3 year total shareholder return of 150.81% points to a strong longer run performance profile.
Scan other liquidity and trading infrastructure stocks that show strong momentum and operational focus by reviewing the hand picked 55 AI infrastructure stocks alongside BGC Group.
After a strong run and a fresh push on trading infrastructure through IPC One, the real question for BGC Group now is simple: is it worth paying today’s price, or does waiting for a cheaper entry make more sense as valuation stacks up next?
Price to earnings of 30.1x for BGC Group: Is it justified?
BGC Group currently trades on a P/E of 30.1x, which places the stock above the peer average yet below the broader US Capital Markets industry.
The P/E ratio shows how much investors are paying for each dollar of BGC Group’s earnings. For a brokerage and financial technology company, it often reflects what the market is willing to pay for its profit profile and growth outlook rather than its assets on the balance sheet.
On one hand, BGC Group is assessed as good value relative to the US Capital Markets industry, where the average P/E sits at 39.3x. On the other hand, the same 30.1x multiple screens as expensive when set against a tighter peer group that trades around 19x earnings. That gap suggests investors are currently willing to pay a higher price for BGC Group’s earnings than for many closer peers, even if the stock trades at a discount to the wider industry.
In simple terms, the current valuation puts BGC Group at a premium to peers but at a discount to the sector benchmark.
Result: Price-to-earnings of 30.1x (OVERVALUED)
However, BGC Group still faces risks if revenue growth does not support a 30.1x P/E, or if trading activity weakens across its core brokerage markets.
Another view on BGC Group using our DCF model
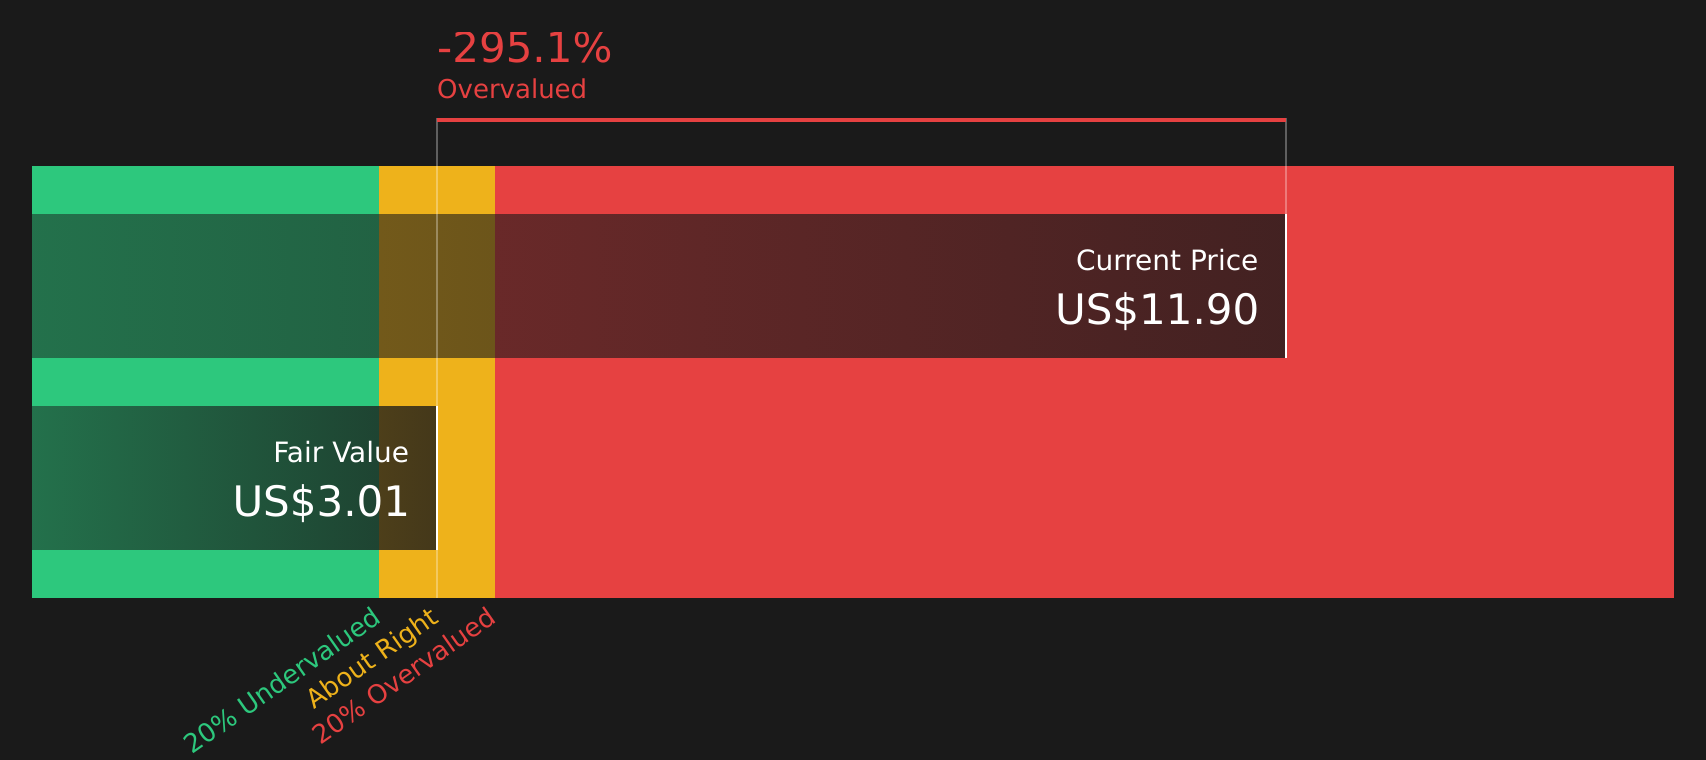
The P/E view suggests BGC Group is at a premium to peers, yet still cheaper than the wider industry. Our DCF model points in a different direction. With the share price at $12.10 and an estimated future cash flow value of $3.02, the stock screens as heavily overvalued on this method.
This kind of gap can matter. If the market leans more on cash flow than earnings multiples over time, today’s price could carry more downside risk than the P/E alone implies.
Simply Wall St performs a discounted cash flow (DCF) on every stock in the world every day (check out BGC Group for example). We show the entire calculation in full. You can track the result in your watchlist or portfolio and be alerted when this changes, or use our stock screener to discover 46 high quality undervalued stocks. If you save a screener we even alert you when new companies match - so you never miss a potential opportunity.
Next Steps
Given the mixed signals around BGC Group, it makes sense to move quickly and review the details for yourself rather than rely on headlines. Take a closer look at the 2 key rewards and 2 important warning signs.
Looking for more investment ideas beyond BGC Group?
If BGC Group has your attention, do not stop there. Broaden your watchlist with other focused opportunities that match your style and risk tolerance.
- Target potential bargains by reviewing companies that combine solid fundamentals with attractive pricing through the 46 high quality undervalued stocks.
- Strengthen your income stream by scanning for reliable high yield opportunities using the 12 dividend fortresses.
- Prioritise capital preservation by focusing on companies that score well on stability and risk with the 76 resilient stocks with low risk scores.
This article by Simply Wall St is general in nature. We provide commentary based on historical data and analyst forecasts only using an unbiased methodology and our articles are not intended to be financial advice. It does not constitute a recommendation to buy or sell any stock, and does not take account of your objectives, or your financial situation. We aim to bring you long-term focused analysis driven by fundamental data. Note that our analysis may not factor in the latest price-sensitive company announcements or qualitative material. Simply Wall St has no position in any stocks mentioned.