

Blue Bird (BLBD) Stock Looks Cheap On Cash Flow While A 246% Run Raises The Bar
Blue Bird Corporation BLBD | 0.00 |
Blue Bird stock has delivered a very strong 245.6% return over the past three years, yet the current valuation checks and an intrinsic value estimate built on a Discounted Cash Flow (DCF) model both still point to the shares trading at a discount to underlying cash flow.
- Over the last three years, Blue Bird has returned 245.6%, which now puts the focus squarely on whether the current price fully reflects its cash generation potential.
- Expectations that Blue Bird can keep converting revenue into cash efficiently may support its valuation, while any pressure on margins or higher capital needs could quickly narrow the apparent discount.
- On Simply Wall St's broader checks, Blue Bird screens as undervalued in 5 of 6 valuation tests, and the DCF based intrinsic value estimate suggests the stock trades about 28.1% below that fair value mark.
The issue now is whether that combination of a strong three year run and a roughly 28.1% DCF discount still leaves enough margin of safety for new money going into Blue Bird.
Does Blue Bird Look Undervalued on Cash Flow?
The Discounted Cash Flow (DCF) model used here estimates what Blue Bird might be worth based on the cash it is expected to generate for shareholders. Blue Bird currently reports latest twelve month free cash flow of about $186 million in reporting currency. The projections used in this 2 Stage Free Cash Flow to Equity model assume cash flows that are growing rather than shrinking over time.
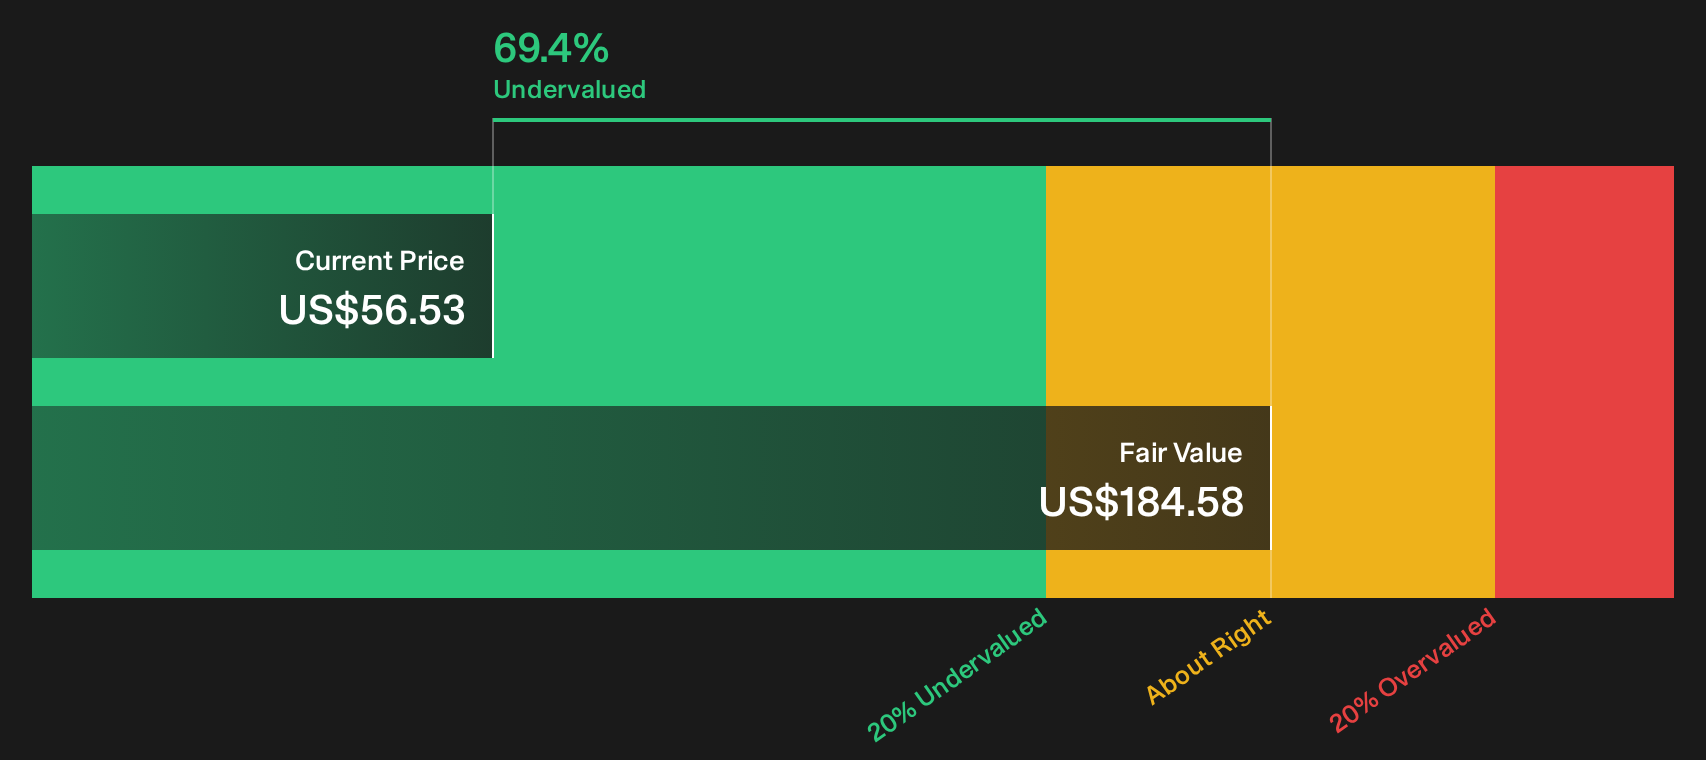
Under those assumptions, the DCF model points to an estimated intrinsic value of about $108.61 per share. Compared with the current share price, this implies the stock trades at roughly a 28.1% discount to that intrinsic value estimate, which suggests the market price does not fully reflect the projected cash generation.
Overall, this Discounted Cash Flow assessment indicates Blue Bird stock currently appears undervalued relative to its modeled cash flows.
Our Discounted Cash Flow (DCF) analysis suggests Blue Bird is undervalued by 28.1%. Track this in your watchlist or portfolio, or discover 44 more high quality undervalued stocks.
Does Blue Bird Look Undervalued on Earnings?
The P/E ratio is a useful reference point for Blue Bird because earnings are a key driver of how investors typically value this type of machinery stock. Blue Bird currently trades at a P/E of about 18.6x, which is below both the Machinery industry average of roughly 26.5x and the peer group average of about 25.2x.
A fair P/E multiple, based on Blue Bird's profile within its industry, is estimated at around 26.5x. Compared with the current 18.6x, this indicates that the market is valuing Blue Bird at a sizeable discount to what might be expected given its earnings, with the gap pointing to a lower earnings multiple than both peers and this fair value yardstick.
On this P/E comparison, Blue Bird stock appears undervalued relative to both its industry and the fair multiple implied by the model.

The Blue Bird Narrative: What Would Justify Today's Price?
Simply Wall St Narratives for Blue Bird pick up where the valuation puzzle leaves off. They spell out which paths for Blue Bird's growth, margins and earnings would need to play out for the stock to be worth meaningfully more or less than today's price on the Community page. Each scenario links its numbers to a clear view on how growth, profitability and risks could evolve, giving you a reference point you can revisit as fresh information comes through.
The community is split on Blue Bird, with one camp focused on replacement demand and cleaner buses, and the other worried about tariffs and funding risk.
Bull case: 6% undervalued
"Blue Bird's leadership in alternative-powered buses (with over 60% of unit mix and exclusive propane offerings) positions it for incremental margin gains versus competitors..."
Bear case: 7% overvalued
"Tariffs, demographic shifts, and subsidy reliance threaten demand, revenue stability, and long-term market size for Blue Bird's electric and alternative-fuel buses..."
Do you think there's more to the story for Blue Bird? Head over to our Community to see what others are saying!
The Bottom Line
For Blue Bird, both the Discounted Cash Flow (DCF) intrinsic value estimate and the earnings multiple comparison point in the same direction, with the stock screening as undervalued on cash flow and relative to peers. The roughly 28.1% gap to the intrinsic value estimate will only matter if Blue Bird can sustain the cash generation and earnings profile that underpin those models.
What really decides the outcome from here is whether margins and capital needs evolve in line with those assumptions. The key question for investors is whether the current discount reflects an opportunity or a fair warning about the risks around funding, demand and profitability that the bear case highlights.
This article by Simply Wall St is general in nature. We provide commentary based on historical data and analyst forecasts only using an unbiased methodology and our articles are not intended to be financial advice. It does not constitute a recommendation to buy or sell any stock, and does not take account of your objectives, or your financial situation. We aim to bring you long-term focused analysis driven by fundamental data. Note that our analysis may not factor in the latest price-sensitive company announcements or qualitative material. Simply Wall St has no position in any stocks mentioned.