Cardinal Health (CAH) Q2 Earnings Strengthen Bullish Narrative On 26.7% TTM EPS Growth
Cardinal Health, Inc. CAH | 211.83 211.83 | -1.45% 0.00% Pre |
Cardinal Health (CAH) just posted its Q2 2026 numbers, with revenue of about US$65.6b, basic EPS of US$1.98 and net income excluding extra items of US$467m setting the tone for the latest update. Over the last few quarters the company has seen revenue move from US$55.3b in Q2 2025 to US$60.2b in Q4 2025, US$64.0b in Q1 2026 and now US$65.6b in Q2 2026. Basic EPS stepped through US$1.65, US$1.00, US$1.89 and US$1.98 over the same periods, which feeds into trailing twelve month EPS of US$6.97 on revenue of US$244.7b. With net profit margins still thin but edging higher year over year, this set of results keeps the focus firmly on how efficiently the company is converting its scale into earnings.
See our full analysis for Cardinal Health.With the latest figures on the table, the next step is to see how these results line up against the most common narratives around Cardinal Health and where the numbers start to challenge the story.
TTM earnings growth outpaces revenue
- Over the last twelve months, Cardinal Health generated US$244.7b in revenue and US$1,662m in net income excluding extra items, with Basic EPS at US$6.97 on a trailing basis.
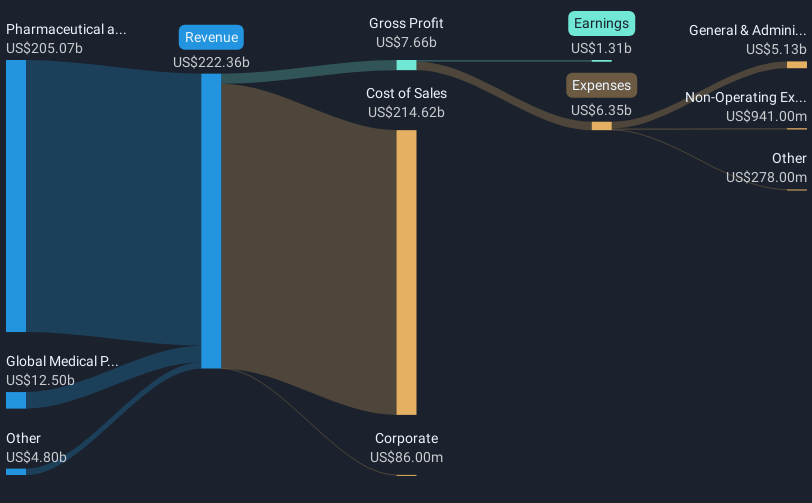
- What stands out for a bullish view is that earnings grew 26.7% over the past year while trailing revenue moved from US$222.3b to US$244.7b. This strongly supports the idea that profit growth has been running ahead of top line expansion even as net margin sits at 0.7%.
- Supporters who point to a 25.2% 5 year earnings growth rate can tie that to the latest twelve month net income of US$1,662m, which is higher than the US$1,312m to US$1,595m range shown in the earlier trailing periods.
- At the same time, the modest move in net margin from 0.6% to 0.7% shows that most of the bullish story still comes from steady profit growth on a very large revenue base rather than from high margins.
Strong profit growth on a thin margin base is exactly the kind of setup bulls like to unpack further in a full thesis, especially when they want to see how durable that pattern looks across different scenarios. 📊 Read the full Cardinal Health Consensus Narrative.
P/E premium versus peers at 32x
- The shares trade on a P/E of about 32x, compared with an average of 28.1x for peers and 23.2x for the wider US Healthcare industry, while the current price of US$226.32 also sits below an analyst price target of US$243.07.
- Critics who focus on valuation argue that a 32x P/E sets a high bar, and the figures here give them some support because forecast earnings growth of roughly 11% per year and revenue growth of about 8.1% per year are both below the 15.6% earnings growth cited for the broader US market.
- The gap between the current share price of US$226.32 and the analyst price target of US$243.07 is relatively small compared with the P/E premium to sector and peer groups. Bears can point to this when they question how much upside is being priced in.
- On the other hand, the same valuation critics have to reconcile their case with the 26.7% earnings growth over the past year, which shows that recent profit expansion has been stronger than the forward growth rates now being discussed.
DCF fair value and debt risk in focus
- The stock is described as trading around 53.5% below a DCF fair value of US$486.81, even as the company is flagged for carrying a high level of debt as a minor risk.
- What is interesting for a bullish angle is how a DCF fair value close to US$486.81, more than double the current US$226.32 share price, lines up with strong trailing earnings growth. The cautious note around leverage reminds investors that higher debt sits in the background of this model driven upside.
- Supporters who lean on that DCF fair value can point to trailing EPS of US$6.97 and net income of US$1,662m as evidence that cash generation potential has scaled with revenue, which is a key input in many valuation frameworks.
- At the same time, the high debt flag means any bullish case that uses the DCF figure needs to stay grounded in how a 0.7% net margin and moderate forecast growth interact with interest costs and balance sheet strength.
Next Steps
Don't just look at this quarter; the real story is in the long-term trend. We've done an in-depth analysis on Cardinal Health's growth and its valuation to see if today's price is a bargain. Add the company to your watchlist or portfolio now so you don't miss the next big move.
See What Else Is Out There
Thin 0.7% net margins, a 32x P/E premium to peers, and a high debt flag all point to meaningful risk around how earnings and leverage interact.
If that mix of rich valuation and balance sheet pressure makes you uneasy, check out 86 resilient stocks with low risk scores to quickly zero in on companies with more resilience built in.
This article by Simply Wall St is general in nature. We provide commentary based on historical data and analyst forecasts only using an unbiased methodology and our articles are not intended to be financial advice. It does not constitute a recommendation to buy or sell any stock, and does not take account of your objectives, or your financial situation. We aim to bring you long-term focused analysis driven by fundamental data. Note that our analysis may not factor in the latest price-sensitive company announcements or qualitative material. Simply Wall St has no position in any stocks mentioned.