

CBL & Associates Properties (CBL) Faces A Fair Value Gap As 2026 Guidance Improves
CBL & Associates Properties, Inc. CBL | 0.00 |
CBL & Associates Properties (CBL) is back in focus after its August earnings update, which showed higher quarterly and half year sales and net income, along with new full year 2026 earnings guidance.
At a share price of US$56.66, CBL & Associates Properties has cooled slightly in the very short term, yet a 30 day share price return of 2.51% and 90 day share price return of 18.73% sit alongside a year to date share price return of 53.43% and a 1 year total shareholder return of 95.38%. This suggests momentum has been building over time as investors digest the stronger 2026 earnings picture, the recent guidance update, the ongoing dividend stream and completion of the current buyback program.
If strong recent performance has you thinking about what else is moving, this is a good moment to broaden your search and uncover 21 top founder-led companies
The share price now sits close to some analysts’ targets, while intrinsic value estimates point to a different figure. So where might the fair value for CBL & Associates Properties really fall within that spread?
Price-to-Earnings of 8.2x: Is it justified?
On a P/E of 8.2x at a last close of $56.66, CBL & Associates Properties looks inexpensive compared to the broader US market and its own Retail REITs peers, although the gap to fair value estimates is narrower.
The P/E ratio compares the current share price with earnings per share and is a common way to gauge how much investors are paying for current profits. For a company like CBL & Associates Properties, with a portfolio of malls, outlet centers and open air assets, this multiple helps you see how the market is pricing its cash generating real estate relative to other listed REITs.
CBL & Associates Properties trades on a P/E of 8.2x compared with an estimated fair P/E of 7x. This implies the current rating is richer than the level the market could move toward over time. At the same time, that 8.2x multiple is far below the peer average of 58.9x for the selected group and also below the wider US Retail REITs industry average of 31.7x, which marks a strong discount versus many comparable stocks.
Result: Price-to-earnings of 8.2x (ABOUT RIGHT)
However, CBL & Associates Properties still faces risks if leasing or reinvestment returns disappoint, or if current earnings guidance and valuation assumptions prove too optimistic.
Another view on CBL & Associates Properties’ value
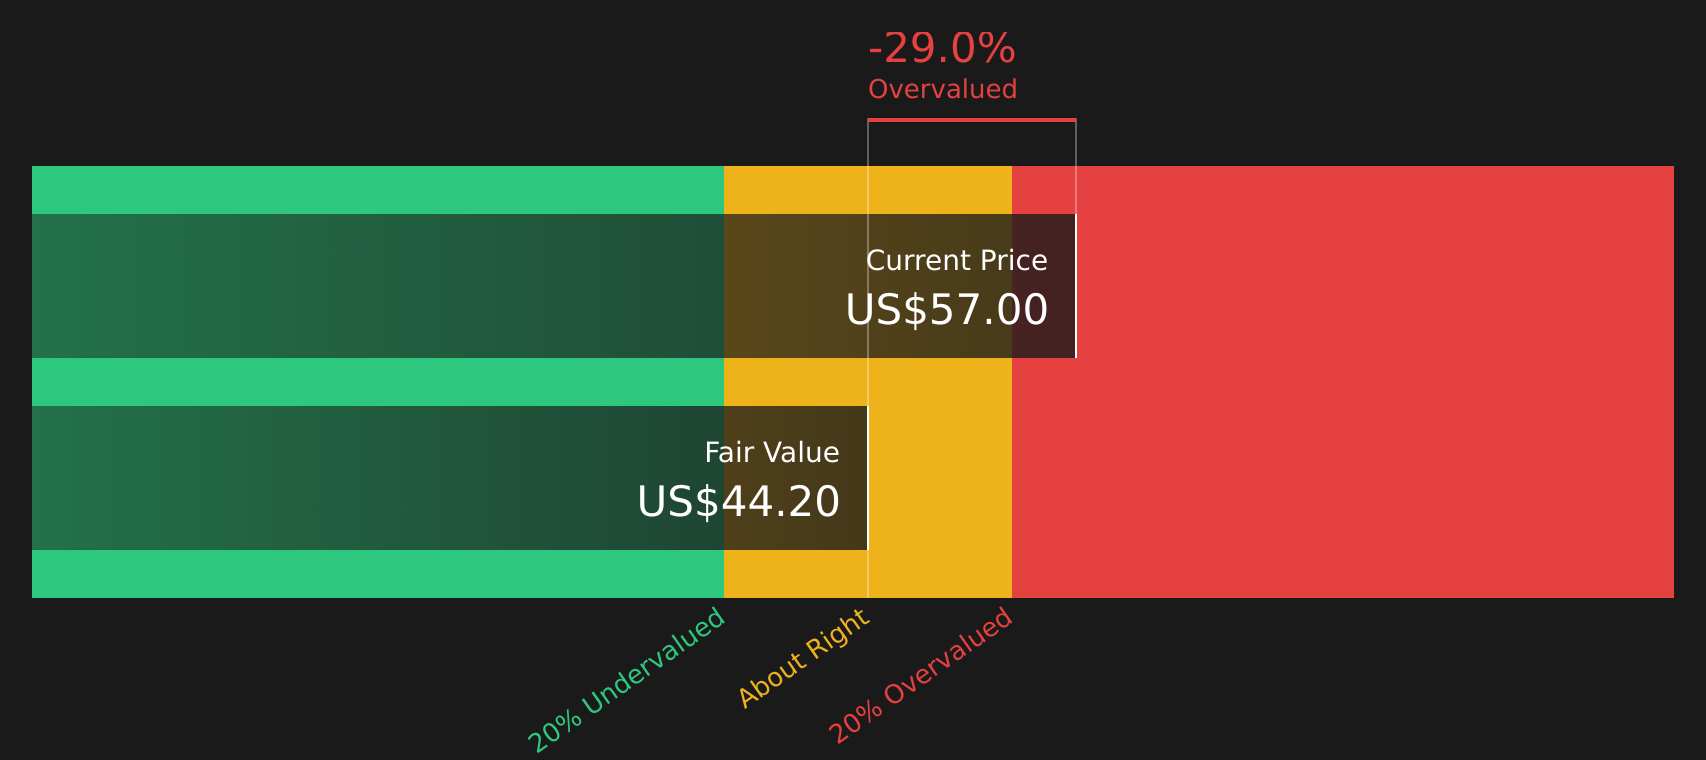
While the current 8.2x P/E suggests CBL & Associates Properties trades at a discount to peers, the SWS DCF model points the other way. On this view, the stock price of $56.66 sits above an estimated future cash flow value of $44.22, which implies less upside than the earnings multiple might hint at.
For investors, that gap is a reminder that cash flow assumptions can paint a more cautious picture than headline earnings. It raises a simple question. Which matters more for you right now, the apparent earnings discount or the DCF signal that flags CBL as trading above future cash flow value?
Simply Wall St performs a discounted cash flow (DCF) on every stock in the world every day (check out CBL & Associates Properties for example). We show the entire calculation in full. You can track the result in your watchlist or portfolio and be alerted when this changes, or use our stock screener to discover 50 high quality undervalued stocks. If you save a screener we even alert you when new companies match - so you never miss a potential opportunity.
Next Steps
With CBL & Associates Properties sending mixed valuation signals and sentiment split between risk and reward, this is a good time to look through the numbers yourself and decide where you stand using the 2 key rewards and 4 important warning signs.
Looking for more investment ideas beyond CBL & Associates Properties?
Do not stop with CBL & Associates Properties. Give yourself options by lining up a few more stocks that match your risk profile and income goals.
- Target dependable income streams by scanning for companies that behave like potential 11 dividend fortresses for your watchlist.
- Seek resilient performers by focusing on businesses highlighted in the 79 resilient stocks with low risk scores to help balance bumpier holdings.
- Hunt for underfollowed potential by checking the screener containing 20 high quality undiscovered gems that pair solid fundamentals with less crowded ownership.
This article by Simply Wall St is general in nature. We provide commentary based on historical data and analyst forecasts only using an unbiased methodology and our articles are not intended to be financial advice. It does not constitute a recommendation to buy or sell any stock, and does not take account of your objectives, or your financial situation. We aim to bring you long-term focused analysis driven by fundamental data. Note that our analysis may not factor in the latest price-sensitive company announcements or qualitative material. Simply Wall St has no position in any stocks mentioned.