Cheniere Energy Partners (CQP) Stock Valuation After US$1.75b Senior Notes Offering
Cheniere Energy Partners, L.P. CQP | 0.00 |
Debt offering sets the stage for fresh investor questions
Cheniere Energy Partners (CQP) has completed a private placement of US$1.75b in senior notes, a financing move that puts its capital structure and long term obligations back in focus for income oriented investors.
The debt offering comes after a mixed stretch for the stock, with the share price down 3.81% over the last day but still showing a 17.02% year to date share price return and a 104.94% five year total shareholder return. This indicates momentum that has built over a longer horizon even as investors reassess risk around new long term obligations.
If this kind of income focused infrastructure story interests you, it can be useful to widen the lens and see what else is out there through the 34 power grid technology and infrastructure stocks
With CQP trading at US$63.19, sitting on a long run of strong total returns and carrying a low value score of 2 plus an indicated 25.14% premium to intrinsic value estimates, is there still a buying opportunity here, or is the market already pricing in future growth?
Price-to-earnings of 14.8x: Is it justified?
CQP trades on a P/E of 14.8x, which sits below the broader US market but above the US oil and gas industry average, so investors are paying a mid range earnings multiple for this kind of infrastructure cash flow profile.
The P/E ratio compares the current share price to earnings per unit, so it effectively shows how many dollars investors are willing to pay today for each dollar of current profit. For a pure play LNG terminal and pipeline operator with long term contracts, this multiple helps you gauge how the market is weighing relatively steady earnings against slower forecast growth.
On one side, CQP is described as expensive versus the US oil and gas industry, with its 14.8x P/E sitting above the 13.8x industry average. On the other side, it screens as good value relative to the wider US market P/E of 19.1x and even more so against a peer average of 23.7x. That spread suggests the market is not treating CQP like the higher multiple peers. The estimated fair P/E of 19.2x indicates a level the valuation might approach if earnings quality and stability remain a focus for investors.
Result: Price-to-earnings of 14.8x (ABOUT RIGHT)
However, you still need to consider risks around long term LNG demand and contract renewal, as well as the impact of higher interest costs on future refinancing decisions.
Another view: DCF sends a very different signal
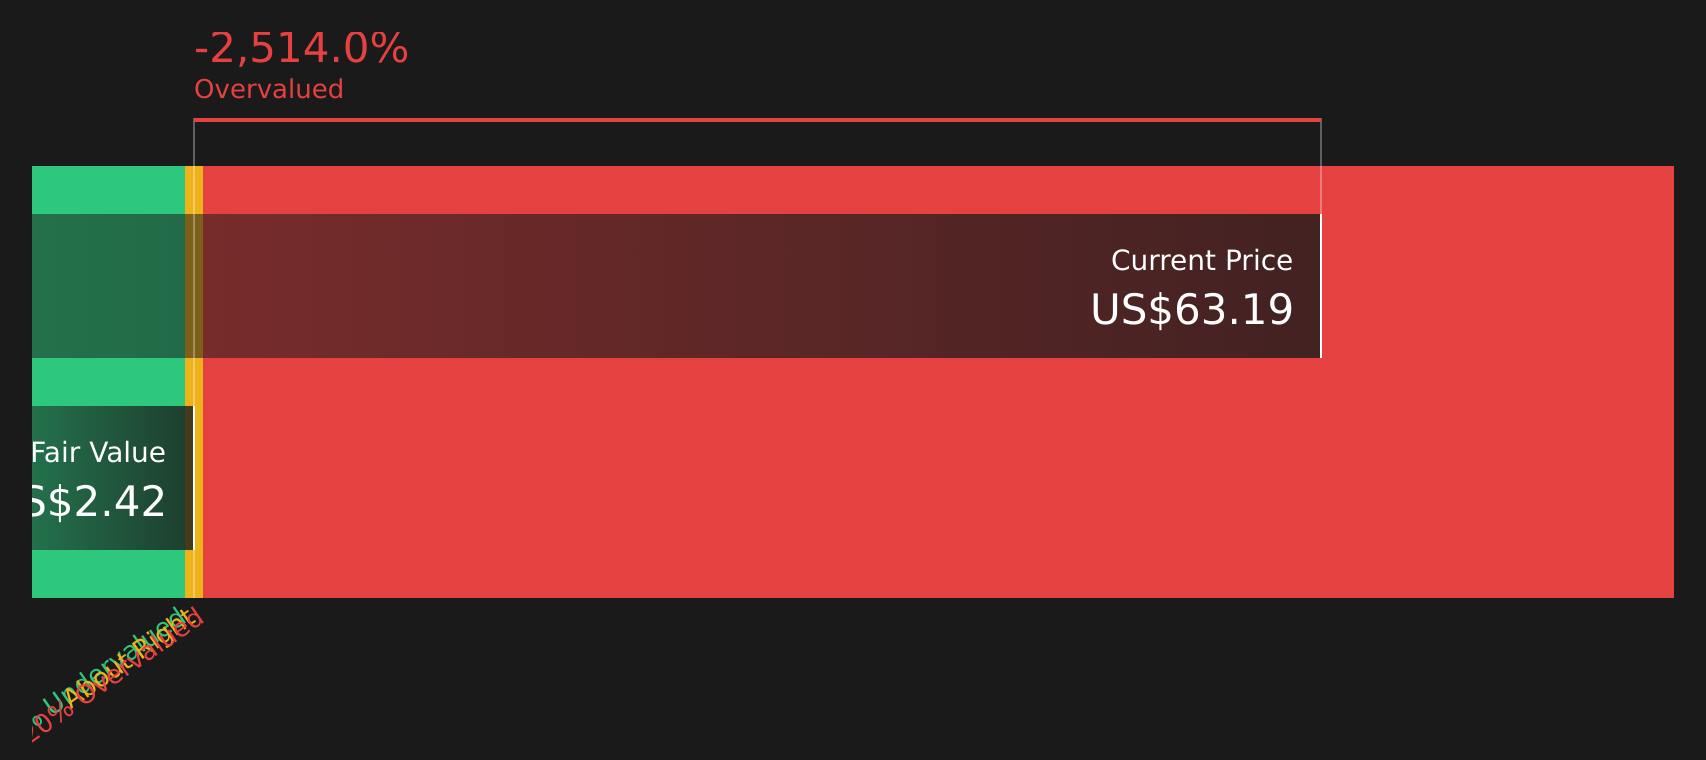
While the 14.8x P/E suggests CQP is roughly in line with what investors are willing to pay for its earnings, the SWS DCF model paints a far harsher picture, with the unit price of $63.19 sitting well above an estimated future cash flow value of just $2.42. That kind of gap points to real valuation risk if cash flows do not match current optimism, so which lens do you trust more when capital is on the line?
Simply Wall St performs a discounted cash flow (DCF) on every stock in the world every day (check out Cheniere Energy Partners for example). We show the entire calculation in full. You can track the result in your watchlist or portfolio and be alerted when this changes, or use our stock screener to discover 44 high quality undervalued stocks. If you save a screener we even alert you when new companies match - so you never miss a potential opportunity.
Next Steps
Does this mix of signals leave you cautious or curious? Act while the details are fresh and weigh the trade off yourself by checking the 2 key rewards and 2 important warning signs
Looking for more investment ideas?
If you stop with just one stock, you risk missing other opportunities that better fit your goals, so keep your options open and keep comparing ideas.
- Target resilience by reviewing companies that show up in the 71 resilient stocks with low risk scores, where lower risk scores can help keep your portfolio steadier through different market conditions.
- Hunt for potential mispriced opportunities by scanning the 44 high quality undervalued stocks, focusing on businesses with solid fundamentals that trade below their assessed value.
- Strengthen your income and capital base by checking the solid balance sheet and fundamentals stocks screener (48 results), highlighting stocks that pair financial stability with underlying business quality.
This article by Simply Wall St is general in nature. We provide commentary based on historical data and analyst forecasts only using an unbiased methodology and our articles are not intended to be financial advice. It does not constitute a recommendation to buy or sell any stock, and does not take account of your objectives, or your financial situation. We aim to bring you long-term focused analysis driven by fundamental data. Note that our analysis may not factor in the latest price-sensitive company announcements or qualitative material. Simply Wall St has no position in any stocks mentioned.