Chubb (CB) Valuation Check After Earnings Beat And Record Investment Income
Chubb Limited CB | 327.27 | +0.47% |
Chubb (CB) is back in focus after reporting fourth quarter net income of US$3.21b and full year net income of US$10.31b. Management pointed to strong insurance operations and record investment income.
The earnings beat and recent buyback activity come after a strong run, with a 30 day share price return of 7.95% and a 1 year total shareholder return of 24.47% signalling momentum that has built gradually over several years, including a 5 year total shareholder return of 113.14%.
If Chubb’s surge has you thinking about what else might be gaining interest, this could be a good moment to broaden your search and check out 23 top founder-led companies
With net income at US$10.31b, a recent buyback of 2.1% of shares, strong total returns, and the stock trading close to analyst targets, you have to ask: is there still a buying opportunity here, or is the market already pricing in future growth?
Most Popular Narrative: 3.4% Undervalued
Chubb's most followed narrative puts fair value at about $336 per share, slightly above the latest close of $324.95, which suggests only a modest valuation gap.
Capital deployment through ongoing share repurchases (new $5b authorization), growing dividends, and selective M&A is creating upward pressure on earnings per share (EPS). At the same time, robust cash flow and capital position provide flexibility for further shareholder returns. Growth in specialized insurance demand such as cyber and high net worth personal lines, driven by macro trends (digitalization, greater risk exposures, climate driven catastrophes), positions Chubb to leverage expertise and scale for above industry average topline and earnings growth.
Want to see what is sitting behind that fair value? The narrative leans on shifting revenue mix, fatter margins, and a future earnings multiple that is anything but random.
Result: Fair Value of $336.22 (UNDERVALUED)
However, those assumptions could be knocked off course if competition continues to pressure pricing or if catastrophe losses and litigation costs remain higher than modeled.
Another Angle on Valuation
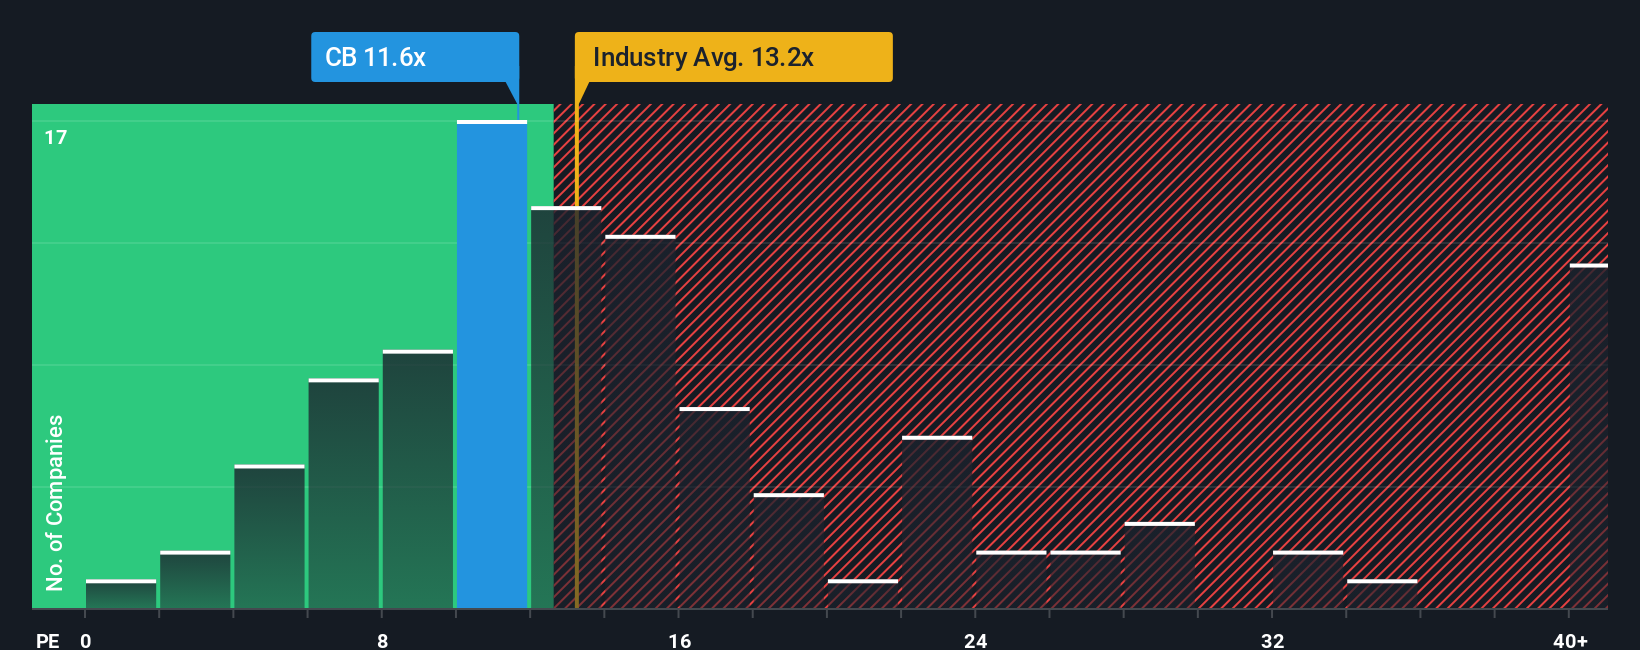
The popular fair value story puts Chubb at about $336 per share and labels it undervalued, but the P/E picture is less clear. The current P/E of 12.3x is higher than peers at 9.1x and exactly in line with the wider US Insurance group at 12.3x, yet below the fair ratio of 13.6x suggested by our model.
In plain terms, the market is already paying more than peers for each dollar of Chubb’s earnings, while still sitting below the level our fair ratio points to as a possible destination. This could be viewed as either limited upside with some valuation risk or a reasonable entry price for a quality insurer.
Build Your Own Chubb Narrative
If you see the numbers differently or prefer to test your own assumptions, it is quick to build a custom view and Do it your way
A great starting point for your Chubb research is our analysis highlighting 2 key rewards and 1 important warning sign that could impact your investment decision.
Looking for more investment ideas?
If you only stop at Chubb, you could miss other opportunities that fit your style, so take a few minutes to scan what else stands out.
- Target reliable cash generators by reviewing companies with a history of strong payouts through 13 dividend fortresses that might match your income goals.
- Spot potential value opportunities fast by filtering for companies that currently look mispriced using 56 high quality undervalued stocks based on solid fundamentals.
- Focus on financial resilience by scanning businesses with strong balance sheets through our solid balance sheet and fundamentals stocks screener (44 results) to see which ones deserve a closer look.
This article by Simply Wall St is general in nature. We provide commentary based on historical data and analyst forecasts only using an unbiased methodology and our articles are not intended to be financial advice. It does not constitute a recommendation to buy or sell any stock, and does not take account of your objectives, or your financial situation. We aim to bring you long-term focused analysis driven by fundamental data. Note that our analysis may not factor in the latest price-sensitive company announcements or qualitative material. Simply Wall St has no position in any stocks mentioned.