

CME Group (CME) Stock Looks Pricey Despite Its 47% Three Year Run
CME Group Inc. Class A CME | 0.00 |
CME Group stock has delivered a strong 47.2% return over the past three years, yet its current checks paint a more balanced picture, with the intrinsic value estimate from the Excess Returns model sitting close to the market price while traditional earnings multiples lean on the expensive side.
- Over the past three years, CME Group has returned 47.2%, which puts recent share price weakness in the context of a longer period of solid gains.
- New product launches such as Single Stock and Beef Trim futures may support expectations for future trading volumes and fee income. At the same time, the planned CEO transition and concerns about how alternative products like perpetual futures affect valuation multiples remain an overhang.
- With a value score of 4 out of 6, CME Group screens as a mixed picture rather than a clear bargain or clear overvaluation on the broader checks.
The issue now is whether CME Group’s current price fairly reflects its intrinsic value estimate and the risks around its earnings multiple.
Does CME Group Look Fairly Valued on Excess Returns?
The Excess Returns model looks at how efficiently CME Group turns its equity base into profits above its estimated cost of capital. In this framework, the starting point is a book value of $73.57 per share and an average return on equity of 16.62%, which feeds into a stable earnings power of $13.62 per share.
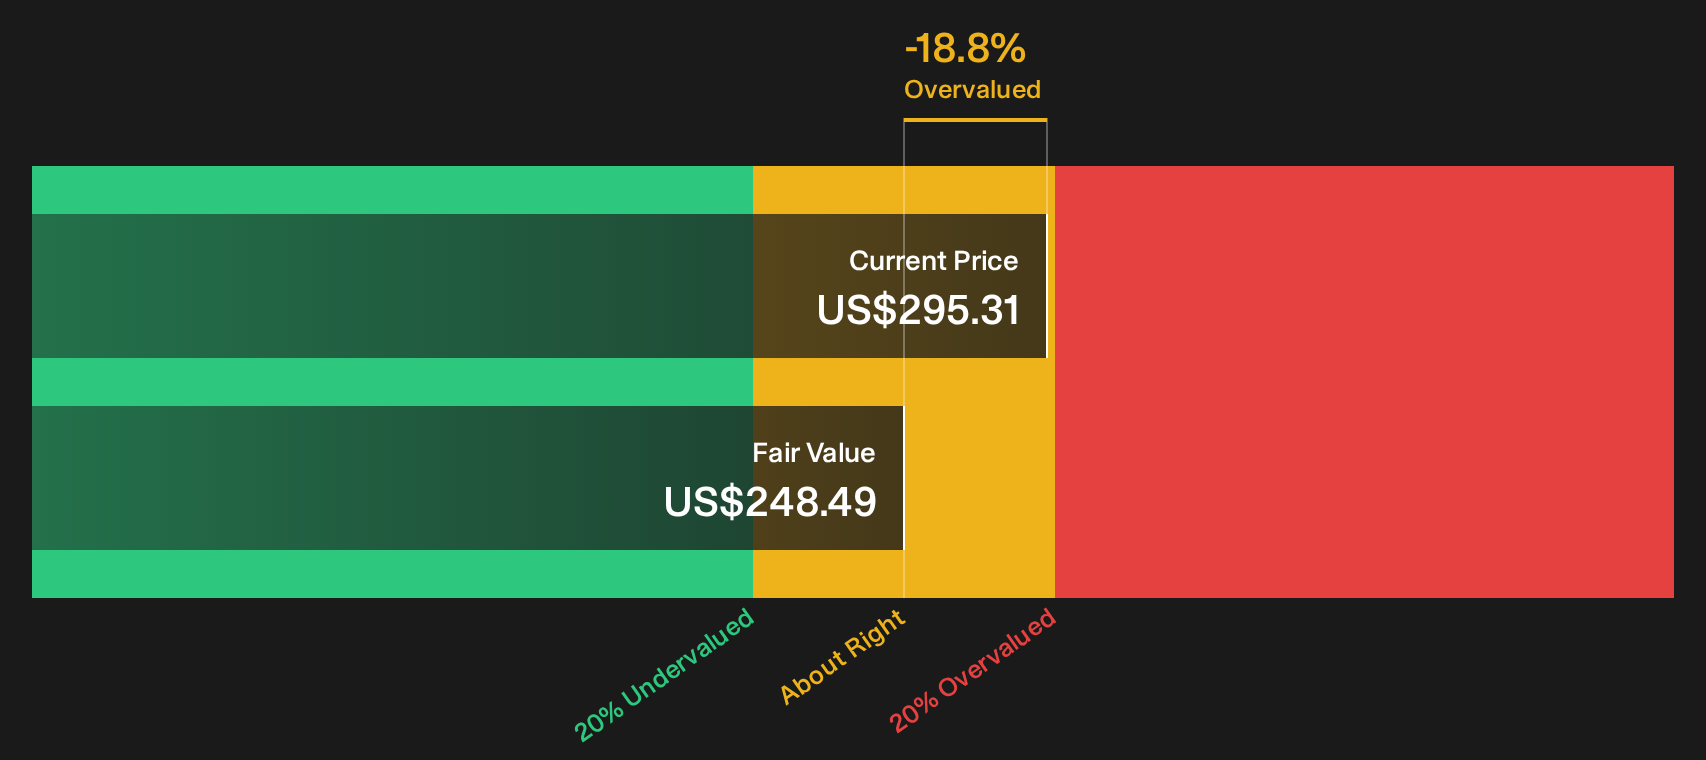
After subtracting a cost of equity of $6.43 per share, the model arrives at an excess return of $7.19 per share and a stable book value of $81.92 per share, based on analyst forecasts. Together, these inputs translate into an intrinsic value estimate of about $249 per share, which is close to the current share price and indicates that CME Group may be trading near what this model views as fair value. Because the planned CEO transition and questions around perpetual futures are in focus, that alignment between price and intrinsic value suggests the market is already weighing both the earnings power and the risks carefully.
On this Excess Returns view, CME Group stock currently appears to be trading near fair value.
CME Group is fairly valued according to our Excess Returns, but this can change at a moment's notice. Track the value in your watchlist or portfolio and be alerted on when to act.
Has CME Group Run Too Far on Earnings?
The P/E ratio is a sensible fit for CME Group because earnings are a key driver of value for a mature, profitable exchange business. On this metric, CME Group trades at about 20.0x, which sits well below the broader Capital Markets industry average of 40.8x and also below a peer group average of 26.8x.
However, the tailored fair P/E ratio for CME Group, which blends its growth profile, margins, size and risk, is lower at about 16.4x. In other words, the current 20.0x multiple stands at a clear premium to what this model indicates would be a more measured price for the stock, even if it does not appear stretched against sector benchmarks.
On the P/E test, CME Group stock screens as overvalued relative to the fair multiple implied by its fundamentals.

The CME Group Narrative: What Would Justify Today's Price?
Simply Wall St Narratives pick up where the valuation puzzle for CME Group leaves off by spelling out which combinations of future growth, margins and earnings would need to hold for the stock to be worth materially more or materially less than today's price, and they sit on Simply Wall St's Community page. Each one treats CME Group's fair value as a thesis about how the business might develop over time, so you can see how that view holds up as new information arrives.
If you have a number driven view on whether CME Group's new Single Stock and Beef Trim futures, record contract volumes or leadership transition ultimately justify today's valuation, share a Narrative in the Simply Wall St community and put your thesis on the record.
It is a chance to add your voice, set out the assumptions behind your view on CME Group's growth, margins and execution, and then watch how that thesis holds up as fresh results and product updates come through.
Do you think there's more to the story for CME Group? Head over to our Community to see what others are saying!
The Bottom Line
For CME Group, the Excess Returns intrinsic value estimate sits close to the current share price, while the tailored P/E screen points to the stock trading as overvalued versus its own fundamentals even if it does not look stretched against peers. That split reflects different lenses, with the intrinsic view anchored on earnings power and capital use, and the multiple view more sensitive to how investors are pricing growth and risk. With broader checks landing in a mixed zone, the key consideration from here is whether CME Group can deliver on its product pipeline and leadership transition in a way that supports holding a richer earnings multiple.
This article by Simply Wall St is general in nature. We provide commentary based on historical data and analyst forecasts only using an unbiased methodology and our articles are not intended to be financial advice. It does not constitute a recommendation to buy or sell any stock, and does not take account of your objectives, or your financial situation. We aim to bring you long-term focused analysis driven by fundamental data. Note that our analysis may not factor in the latest price-sensitive company announcements or qualitative material. Simply Wall St has no position in any stocks mentioned.