CorVel (CRVL) Stock Could Be 40% Below Fair Value After Marketwise Repricing Launch
CorVel Corporation CRVL | 0.00 |
CorVel’s New Marketwise Repricing Product
CorVel (CRVL) has launched Marketwise Repricing, a medical bill repricing product that uses market-based reimbursement data to support more consistent pricing and cost containment across its existing bill review programs.
CorVel’s launch of Marketwise Repricing arrives after a period where short term momentum has softened, with the 30 day share price return down 6.72% and the year to date share price return down 10.98%, while the 5 year total shareholder return is 33.53%.
If you are comparing CorVel with other opportunities in healthcare technology, this could be a good time to see which companies stand out in a dedicated screener for AI driven healthcare stocks such as 40 healthcare AI stocks.
With CorVel shares down over the past year but showing a 5 year total shareholder return of 33.53% and an estimated intrinsic discount of about 40%, it raises a key question: is this a genuine value opportunity, or is the market already pricing in future growth?
Price-to-Earnings of 26.9x: Is it justified for CorVel?
On Simply Wall St’s numbers, CorVel trades at a P/E of 26.9x, which screens as good value against its peer group average of 88.6x but looks more expensive than the broader US Healthcare sector on 23.4x.
The P/E ratio compares CorVel’s share price with its earnings per share and is a common way to judge what investors are paying for each dollar of current profit. For a business focused on workers’ compensation and medical cost containment, this can be a useful shorthand for how the market is weighing its profitability and earnings track record.
Crucially, that 26.9x P/E is anchored by a history of earnings growth of 14.5% per year over the past 5 years, with profit growth over the last year of 16% and net profit margins at 11.5% compared with 10.6% a year earlier. The high 28% return on equity and assessment of high quality earnings also sit behind the multiple, even though there is not enough analyst data to show clear forecasts for future earnings or returns on equity.
Against the wider US Healthcare industry average of 23.4x, CorVel’s P/E looks elevated, which suggests investors are paying a premium relative to the sector even if the stock is cheaper than its closer peer set. That premium appears tied to its profit growth profile and profitability metrics rather than to any clearly quantified future growth projections, given the lack of forecast data.
Result: Price-to-Earnings of 26.9x (ABOUT RIGHT)
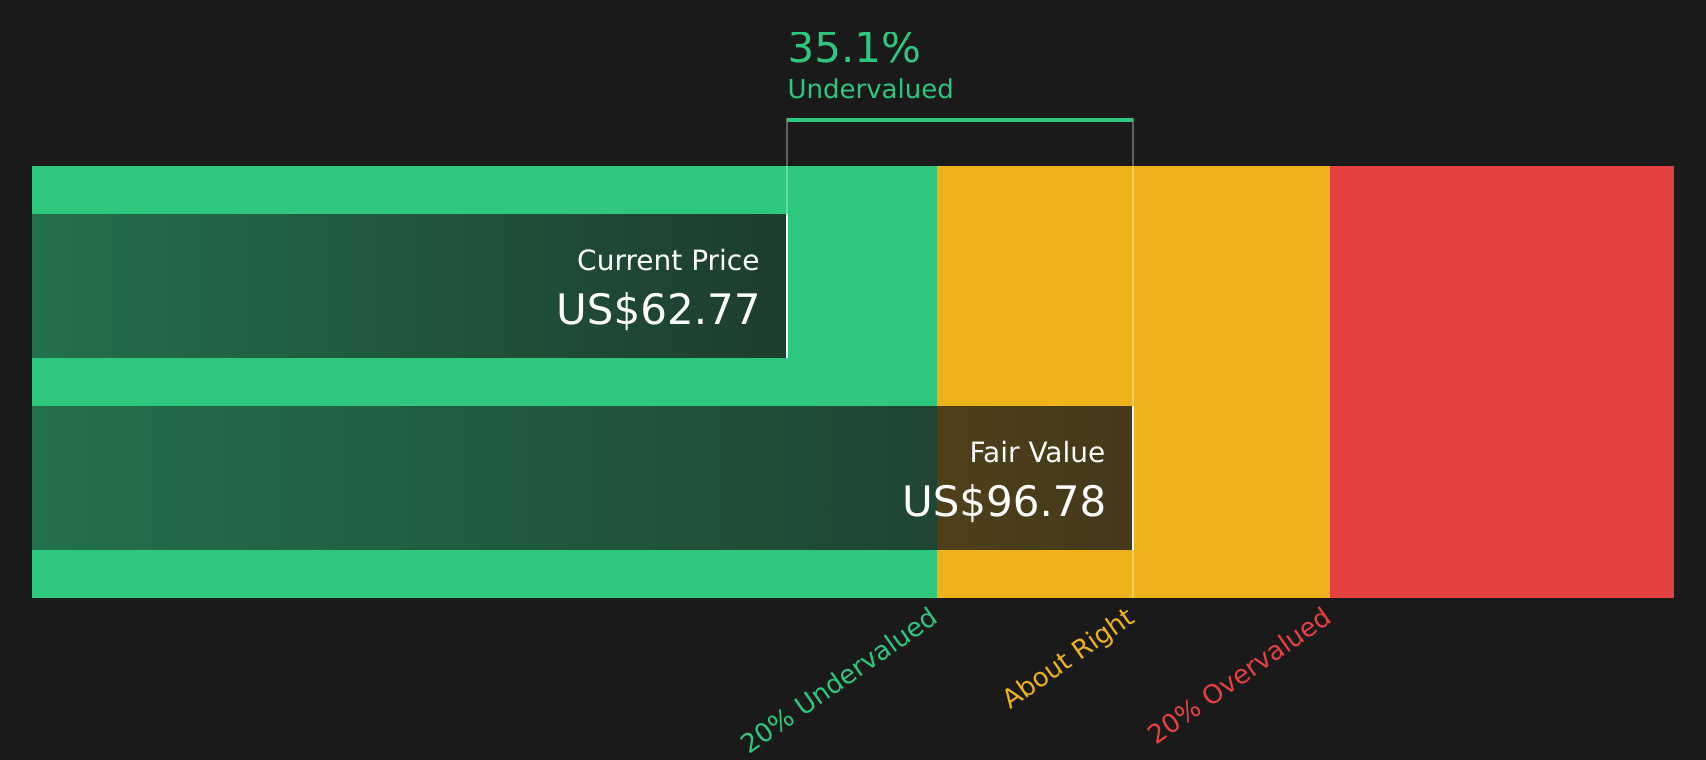
DCF fair value suggests CorVel may be undervalued
Alongside the P/E view, the SWS DCF model estimates a fair value of $97.39 for CorVel, compared with the last close of $58.53. This implies the shares trade at a heavy discount to the model’s future cash flow estimate.
The DCF approach projects CorVel’s future cash flows and discounts them back to today using a required rate of return, aiming to capture the value of those future earnings in present dollar terms. Unlike a simple multiple, it focuses on the size and timing of cash flows rather than only current profits.
For a company like CorVel, with a profit history, 11.5% net margins, and an emphasis on technology driven cost containment services, a cash flow based lens can matter because it puts more weight on the durability and scale of those cash streams than on a single year’s earnings. The model output is one estimate rather than a guarantee. However, the gap between $97.39 and $58.53 is large enough that readers may want to understand how the underlying assumptions line up with their own expectations for the business.
Result: DCF Fair value of $97.39 (UNDERVALUED)
However, CorVel’s recent 1 year total shareholder return decline of 42.68%, along with the lack of analyst forecasts, means sentiment or untested expectations could quickly challenge this valuation story.
Another View on CorVel’s Valuation
That sizeable discount to the SWS DCF model is hard to ignore, but it sits alongside a P/E of 26.9x that is higher than the broader US Healthcare sector on 23.4x. One signal points to value, the other to a premium, which naturally raises the question of which will matter more over time.
Simply Wall St performs a discounted cash flow (DCF) on every stock in the world every day (check out CorVel for example). We show the entire calculation in full. You can track the result in your watchlist or portfolio and be alerted when this changes, or use our stock screener to discover 45 high quality undervalued stocks. If you save a screener we even alert you when new companies match - so you never miss a potential opportunity.
Next Steps
If this mix of risks and rewards around CorVel leaves you undecided, check the numbers, consider the context, and weigh both sides through the 2 key rewards and 1 important warning sign.
Looking for more investment ideas beyond CorVel?
If CorVel has caught your attention, do not stop there. Use this moment to widen your watchlist and compare other opportunities before the market moves ahead of you.
- Spot potential mispricings early by scanning 45 high quality undervalued stocks that pair strong fundamentals with appealing valuations.
- Strengthen your income focus by reviewing 8 dividend fortresses that combine sizeable yields with an emphasis on resilience.
- Prioritize capital preservation by assessing 65 resilient stocks with low risk scores that aim for more stable risk profiles.
This article by Simply Wall St is general in nature. We provide commentary based on historical data and analyst forecasts only using an unbiased methodology and our articles are not intended to be financial advice. It does not constitute a recommendation to buy or sell any stock, and does not take account of your objectives, or your financial situation. We aim to bring you long-term focused analysis driven by fundamental data. Note that our analysis may not factor in the latest price-sensitive company announcements or qualitative material. Simply Wall St has no position in any stocks mentioned.