Cushman & Wakefield (CWK) Stock After Recent 1 Year Surge And DCF Valuation Gap
CUSHMAN & WAKEFIELD PLC CWK | 0.00 |
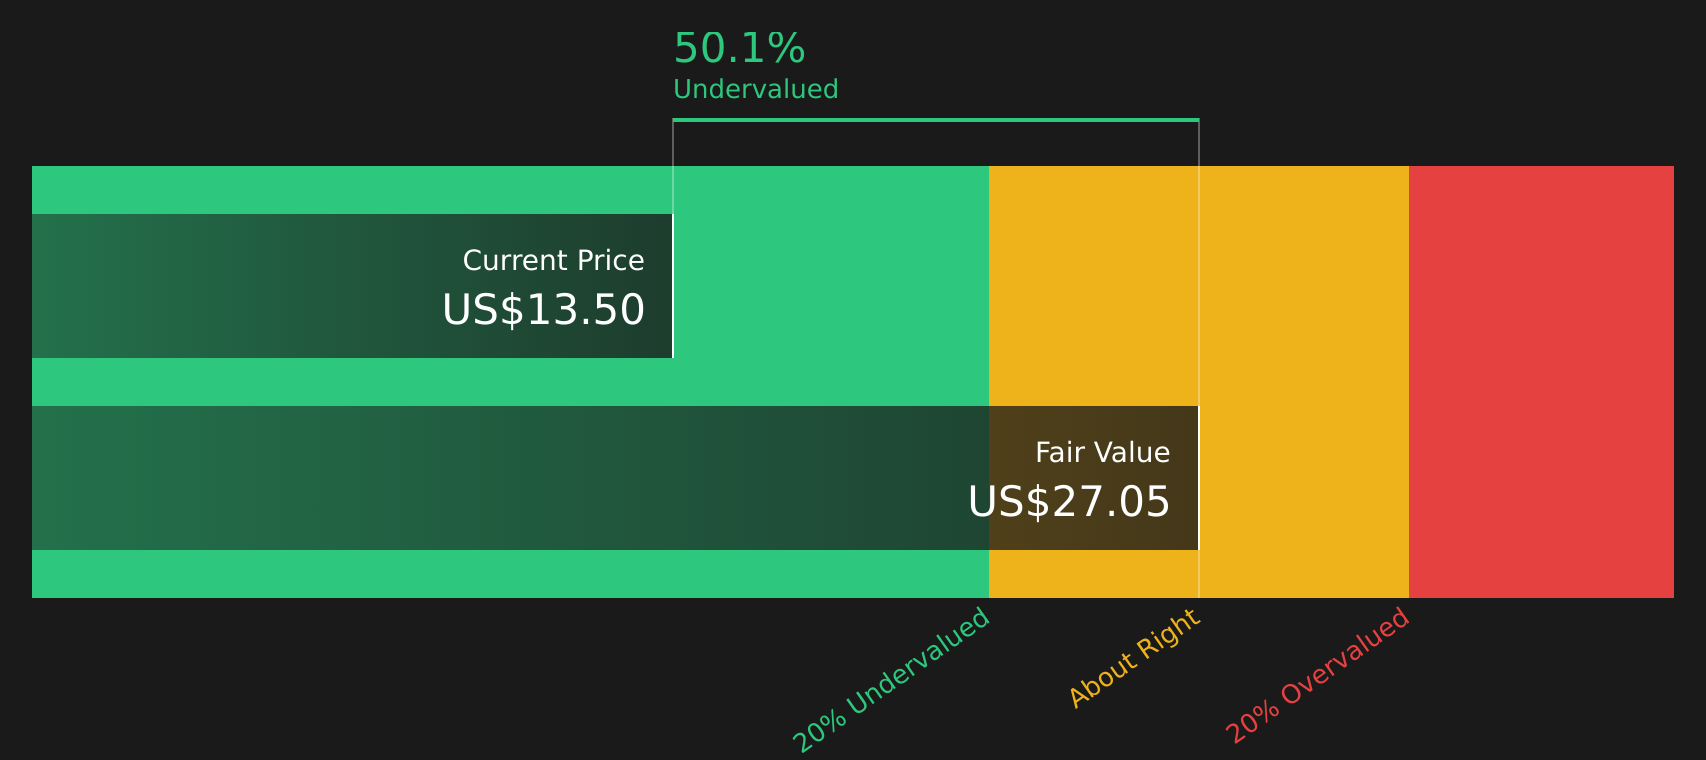
- If you are wondering whether Cushman & Wakefield at around US$13.50 is pricing in too much optimism or still leaving value on the table, the numbers offer some useful clues.
- The stock has returned 1.0% over the past week and 3.5% over the past month, while year to date it is down 14.8% and the 1 year return sits at 29.7%, with a 3 year return of 53.9% and a 5 year return that has declined 23.4%.
- Recent coverage has focused on Cushman & Wakefield within the broader real estate sector, with attention on how listed property and services stocks are responding to ongoing shifts in commercial real estate demand. This context helps explain why the share price moves are attracting fresh interest from investors assessing risk and potential reward.
- Cushman & Wakefield currently has a valuation score of 4/6. The rest of this article will compare different valuation approaches around that score and finish by showing a more comprehensive way to think about what the stock might be worth.
Approach 1: Cushman & Wakefield Discounted Cash Flow (DCF) Analysis
A Discounted Cash Flow, or DCF, model estimates what a stock could be worth by projecting future cash flows and discounting them back to today to account for risk and the time value of money.
For Cushman & Wakefield, the model uses a 2 Stage Free Cash Flow to Equity approach. The latest twelve month Free Cash Flow stands at about $208.3 million. Analysts provide explicit estimates for the next few years, and Simply Wall St then extrapolates those cash flows further out. Under this framework, projected Free Cash Flow in 2030 is $491 million, with intermediate annual projections between 2026 and 2035 ranging from $267 million to $690.3 million in nominal terms.
When these future cash flows are discounted back, the DCF model arrives at an estimated intrinsic value of $26.82 per share. Compared with the recent share price of about $13.50, this implies the stock is trading at a 49.7% discount to that DCF estimate, which points to a meaningful gap between price and this model’s valuation.
Result: UNDERVALUED
Our Discounted Cash Flow (DCF) analysis suggests Cushman & Wakefield is undervalued by 49.7%. Track this in your watchlist or portfolio, or discover 44 more high quality undervalued stocks.
Approach 2: Cushman & Wakefield Price vs Earnings
For profitable companies, the P/E ratio is a useful quick check because it links what you pay for each share with the earnings that support that price. Higher growth potential and lower perceived risk usually justify a higher P/E, while slower growth or higher risk tend to line up with a lower, more cautious P/E range.
Cushman & Wakefield currently trades on a P/E of 42.9x. That sits above the Real Estate industry average of 28.4x and below the peer group average of 48.3x. On the surface, this suggests the stock is priced more richly than the broader industry but not as highly as some direct peers.
Simply Wall St also uses a proprietary “Fair Ratio” for P/E, which is 24.5x for Cushman & Wakefield. This metric aims to reflect what might be reasonable given factors such as the company’s earnings growth profile, industry, profit margins, market cap and specific risks, rather than relying only on broad industry or peer comparisons. Because it is tailored to the company’s characteristics, it can provide a more targeted reference point for your assessment.
Comparing the current P/E of 42.9x with the Fair Ratio of 24.5x suggests the stock is trading above that Fair Ratio benchmark.
Result: OVERVALUED

P/E ratios tell one story, but what if the real opportunity lies elsewhere? Start investing in legacies, not executives. Discover our 20 top founder-led companies.
Upgrade Your Decision Making: Choose your Cushman & Wakefield Narrative
Earlier it was mentioned that there is an even better way to understand valuation. Narratives bring that to life by letting you set a simple story for Cushman & Wakefield, link it to assumptions about future revenue, earnings and margins, and convert it into a Fair Value that you can compare with the current share price on Simply Wall St's Community page. On that page, Narratives are updated as new news or earnings arrive, and different investors may, for example, anchor on a more cautious Fair Value near US$14.00 or a more optimistic view closer to US$21.00, all using the same stock but telling different stories about how its business could develop.
Do you think there's more to the story for Cushman & Wakefield? Head over to our Community to see what others are saying!

This article by Simply Wall St is general in nature. We provide commentary based on historical data and analyst forecasts only using an unbiased methodology and our articles are not intended to be financial advice. It does not constitute a recommendation to buy or sell any stock, and does not take account of your objectives, or your financial situation. We aim to bring you long-term focused analysis driven by fundamental data. Note that our analysis may not factor in the latest price-sensitive company announcements or qualitative material. Simply Wall St has no position in any stocks mentioned.