

Does CTS (CTS) Boosted Dividend Reveal a Confident Capital Strategy or Limited Reinvention Options?
CTS Corporation CTS | 0.00 |
- Earlier this month, CTS Corporation’s board declared a cash dividend of US$0.04 per share, payable on July 24, 2026 to shareholders of record as of June 26, 2026.
- The dividend decision comes as analysts and brokers maintain very positive views on CTS, reflecting confidence in its earnings estimates and operational outlook.
- With the new dividend and improving sentiment around industrial and transportation demand, we’ll now examine how this affects CTS’s investment narrative.
AI is about to change healthcare. These 34 stocks are working on everything from early diagnostics to drug discovery. The best part - they are all under $10b in market cap - there's still time to get in early.
CTS Investment Narrative Recap
To own CTS, you have to believe its shift toward industrial, medical, and connectivity applications can more than offset pressure in transportation and tariff exposed markets. The new US$0.04 dividend and upbeat market sentiment around industrial and transportation demand reinforce the near term earnings catalyst, but they do not materially change the core risk that softness in transportation volumes or China related weakness could weigh on revenue and margin resilience.
Among recent announcements, the Q1 2026 results stand out, with sales of US$139.23 million and diluted EPS of US$0.59, alongside slightly raised full year sales guidance to US$560 million to US$580 million. That operational progress, combined with an active buyback program, sits against the same key risk that a prolonged downturn or competitive pressure in transportation, especially from Chinese OEMs in Europe, could still pressure CTS’s largest historical revenue stream.
But despite the recent dividend news and improved sentiment, investors should still be mindful of how exposed CTS remains to softer transportation demand and evolving tariffs...
CTS' narrative projects $639.6 million revenue and $89.0 million earnings by 2029. This requires 4.9% yearly revenue growth and a $19.9 million earnings increase from $69.1 million.
Uncover how CTS' forecasts yield a $58.00 fair value, a 7% downside to its current price.
Exploring Other Perspectives
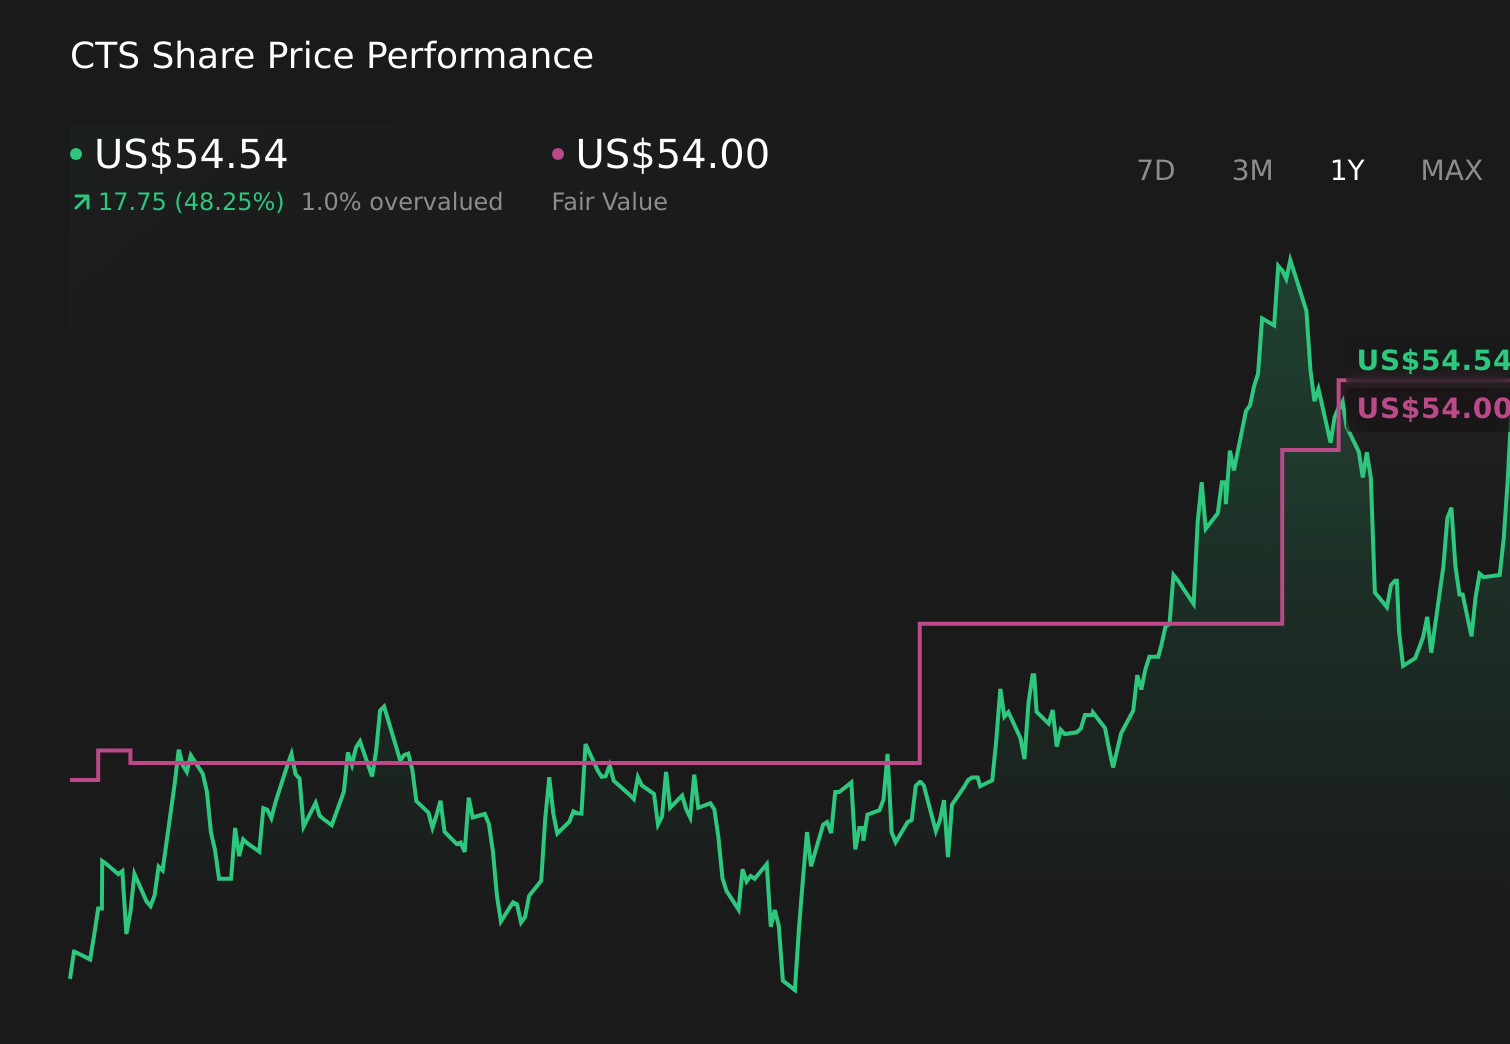
Two fair value estimates from the Simply Wall St Community cluster tightly between US$58.00 and about US$61.79, underscoring how closely some private investors are modeling CTS today. You should weigh these views against the ongoing risk that transportation softness or tariff shifts could pressure CTS’s largest legacy revenue base and consider how different scenarios might affect the company’s progress in newer industrial and medical markets.
Explore 2 other fair value estimates on CTS - why the stock might be worth as much as $61.79!
Reach Your Own Conclusion
Disagree with existing narratives? Extraordinary investment returns rarely come from following the herd, so go with your instincts.
- A great starting point for your CTS research is our analysis highlighting 3 key rewards that could impact your investment decision.
- Our free CTS research report provides a comprehensive fundamental analysis summarized in a single visual - the Snowflake - making it easy to evaluate CTS' overall financial health at a glance.
No Opportunity In CTS?
Right now could be the best entry point. These picks are fresh from our daily scans. Don't delay:
- Capitalize on the AI infrastructure supercycle with our selection of the 46 best 'picks and shovels' of the AI gold rush converting record-breaking demand into massive cash flow.
- Find 48 companies with promising cash flow potential yet trading below their fair value.
- Explore 28 top quantum computing companies leading the revolution in next-gen technology and shaping the future with breakthroughs in quantum algorithms, superconducting qubits, and cutting-edge research.
This article by Simply Wall St is general in nature. We provide commentary based on historical data and analyst forecasts only using an unbiased methodology and our articles are not intended to be financial advice. It does not constitute a recommendation to buy or sell any stock, and does not take account of your objectives, or your financial situation. We aim to bring you long-term focused analysis driven by fundamental data. Note that our analysis may not factor in the latest price-sensitive company announcements or qualitative material. Simply Wall St has no position in any stocks mentioned.