

Does SM Energy’s (SM) Steady Dividend Reveal Its Post-Merger Capital Priorities In Shale?
SM Energy Company SM | 0.00 |
- SM Energy Company recently announced that its Board of Directors approved a quarterly cash dividend of US$0.22 per share, payable on June 22, 2026 to stockholders of record as of June 8, 2026.
- This payout decision comes as the company manages shifting oil market conditions and integrates its expanded shale portfolio following the Civitas Resources merger.
- With the dividend affirmation set against easing Iran-related tensions pressuring crude prices, we’ll examine how this shapes SM Energy’s investment narrative.
Find 46 companies with promising cash flow potential yet trading below their fair value.
SM Energy Investment Narrative Recap
To own SM Energy today, you need to believe the enlarged shale platform can keep converting strong production into dependable cash returns, even as oil prices react to shifting geopolitics. The latest US$0.22 per share quarterly dividend affirmation looks more like a confirmation of existing capital plans than a change to the story, so it does not materially alter the key near term catalyst of merger integration progress or the main risk around basin concentration and shale reinvestment needs.
In that context, the all stock merger with Civitas Resources looms larger than the dividend itself. Management reports about US$300 million of synergies already realized and a higher annual synergy target of US$375 million by the end of 2026, which many investors see as central to supporting ongoing shareholder payouts, debt refinancing moves and SM Energy’s ability to absorb commodity price swings without eroding free cash flow.
But while the dividend may look reassuring, investors should also be aware of how SM Energy’s heavy concentration in a few shale basins could...
SM Energy's narrative projects $3.5 billion revenue and $550.3 million earnings by 2028.
Uncover how SM Energy's forecasts yield a $28.82 fair value, a 9% downside to its current price.
Exploring Other Perspectives
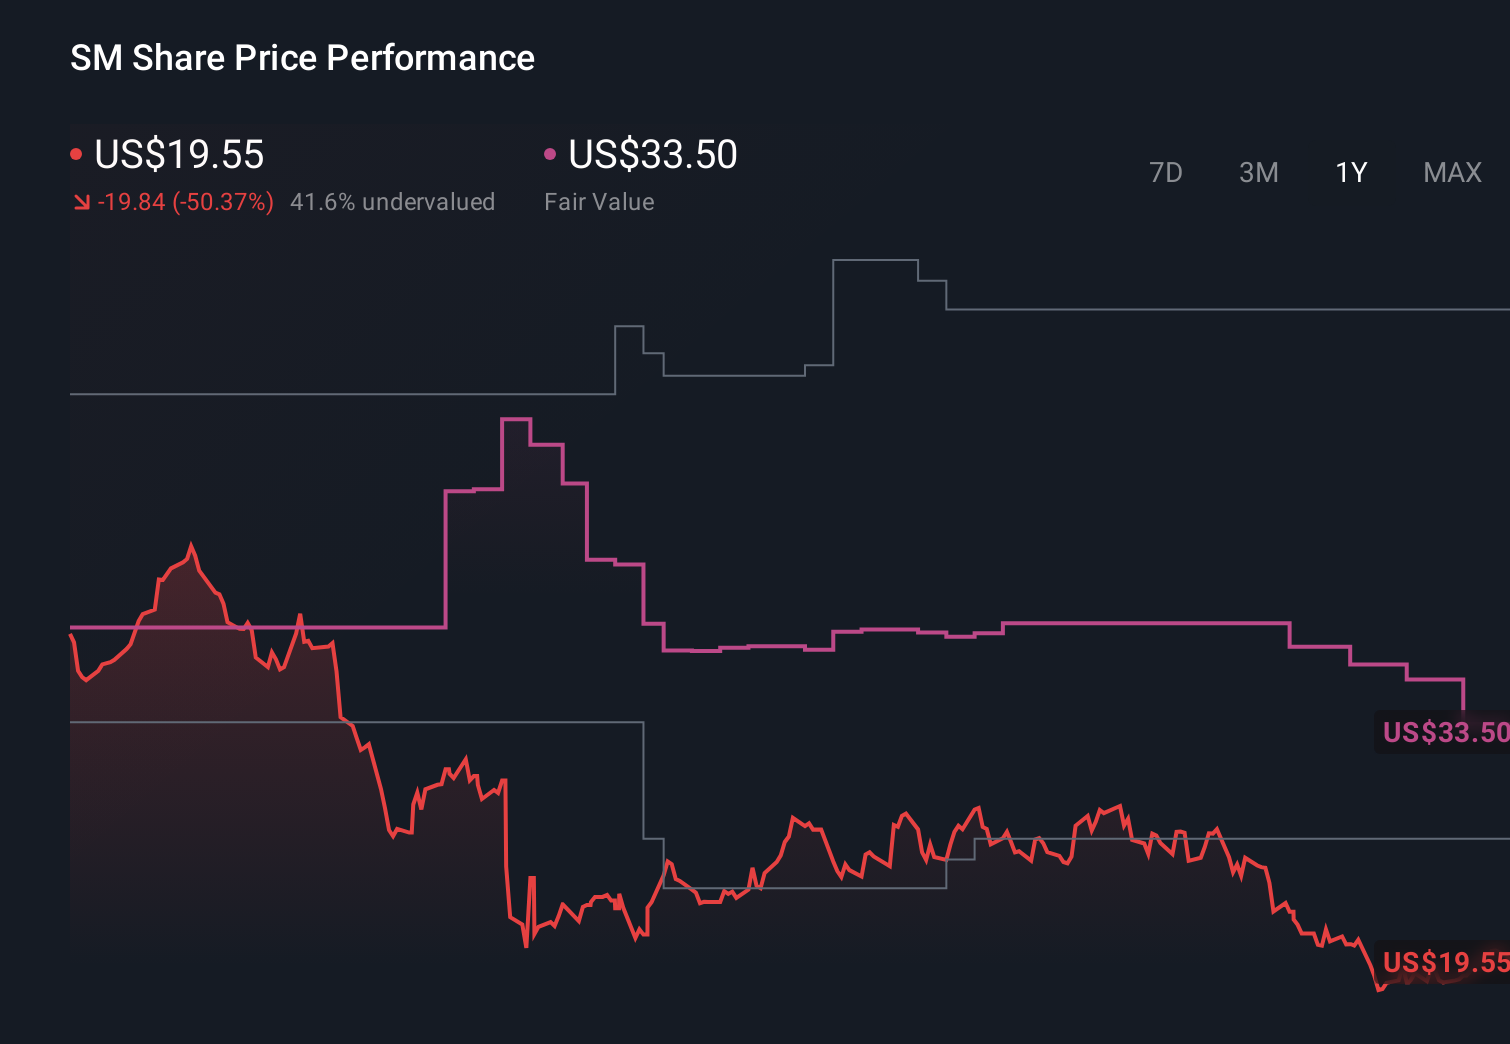
Some of the lowest ranked analysts take a much harsher view, warning that accelerating decarbonization and ESG funding pressure could curb access to capital even if revenues do reach about US$7.6 billion and earnings US$1.5 billion by 2029, so it is worth weighing this more pessimistic path alongside the recent dividend news and your own expectations.
Explore 6 other fair value estimates on SM Energy - why the stock might be worth over 6x more than the current price!
The Verdict Is Yours
Disagree with existing narratives? Extraordinary investment returns rarely come from following the herd, so go with your instincts.
- A great starting point for your SM Energy research is our analysis highlighting 3 key rewards and 5 important warning signs that could impact your investment decision.
- Our free SM Energy research report provides a comprehensive fundamental analysis summarized in a single visual - the Snowflake - making it easy to evaluate SM Energy's overall financial health at a glance.
Curious About Other Options?
Opportunities like this don't last. These are today's most promising picks. Check them out now:
- Capitalize on the AI infrastructure supercycle with our selection of the 47 best 'picks and shovels' of the AI gold rush converting record-breaking demand into massive cash flow.
- Uncover the next big thing with 25 elite penny stocks that balance risk and reward.
- The future of work is here. Discover the 34 top robotics and automation stocks leading the charge in AI-driven automation and industrial transformation.
This article by Simply Wall St is general in nature. We provide commentary based on historical data and analyst forecasts only using an unbiased methodology and our articles are not intended to be financial advice. It does not constitute a recommendation to buy or sell any stock, and does not take account of your objectives, or your financial situation. We aim to bring you long-term focused analysis driven by fundamental data. Note that our analysis may not factor in the latest price-sensitive company announcements or qualitative material. Simply Wall St has no position in any stocks mentioned.