

Dycom Industries (DY) Is Down 9.3% After Russell Index Upgrade and Bullish Outlook Shift - What's Changed
Dycom Industries, Inc. DY | 0.00 |
- In late June 2026, Dycom Industries, Inc. was removed from several Russell 2000 indexes and simultaneously added to multiple Russell 1000, 2500, 3000, Midcap, Growth, Value, and Dynamic benchmarks, reflecting a reclassification within the Russell index family.
- This reshuffling, coming on the heels of Dycom’s very strong quarterly earnings and upgraded full-year outlook, shifts the company into larger-cap and value-oriented index universes that can influence which institutional investors gain or lose exposure to the stock.
- With Dycom’s index migration and stronger-than-expected earnings now in focus, we’ll examine how the upbeat guidance reshapes its investment narrative.
Uncover the next big thing with 20 elite penny stocks that balance risk and reward.
Dycom Industries Investment Narrative Recap
To own Dycom Industries, you need to believe in a long runway for fiber, telecom and data infrastructure spending, supported by disciplined execution on large, complex projects. The Russell index migration itself does not materially change Dycom’s core near term catalyst, which remains the delivery against its upgraded FY2027 revenue outlook, or its biggest risk, which is revenue concentration among a handful of large telecom customers.
The recent Q1 FY2027 earnings release, where Dycom reported US$1,964.78 million in revenue and raised full year revenue guidance to US$7.38–7.65 billion, is most relevant here. Stronger than expected results and guidance give more weight to the bullish narrative behind the index reclassification, while also sharpening investor focus on whether major customers keep spending at levels needed to support that outlook.
Yet despite the strong guidance, Dycom’s dependence on a few large telecom customers is a risk investors should be aware of if those customers...
Dycom Industries’ narrative projects $9.7 billion revenue and $607.0 million earnings by 2029.
Uncover how Dycom Industries' forecasts yield a $637.27 fair value, a 49% upside to its current price.
Exploring Other Perspectives
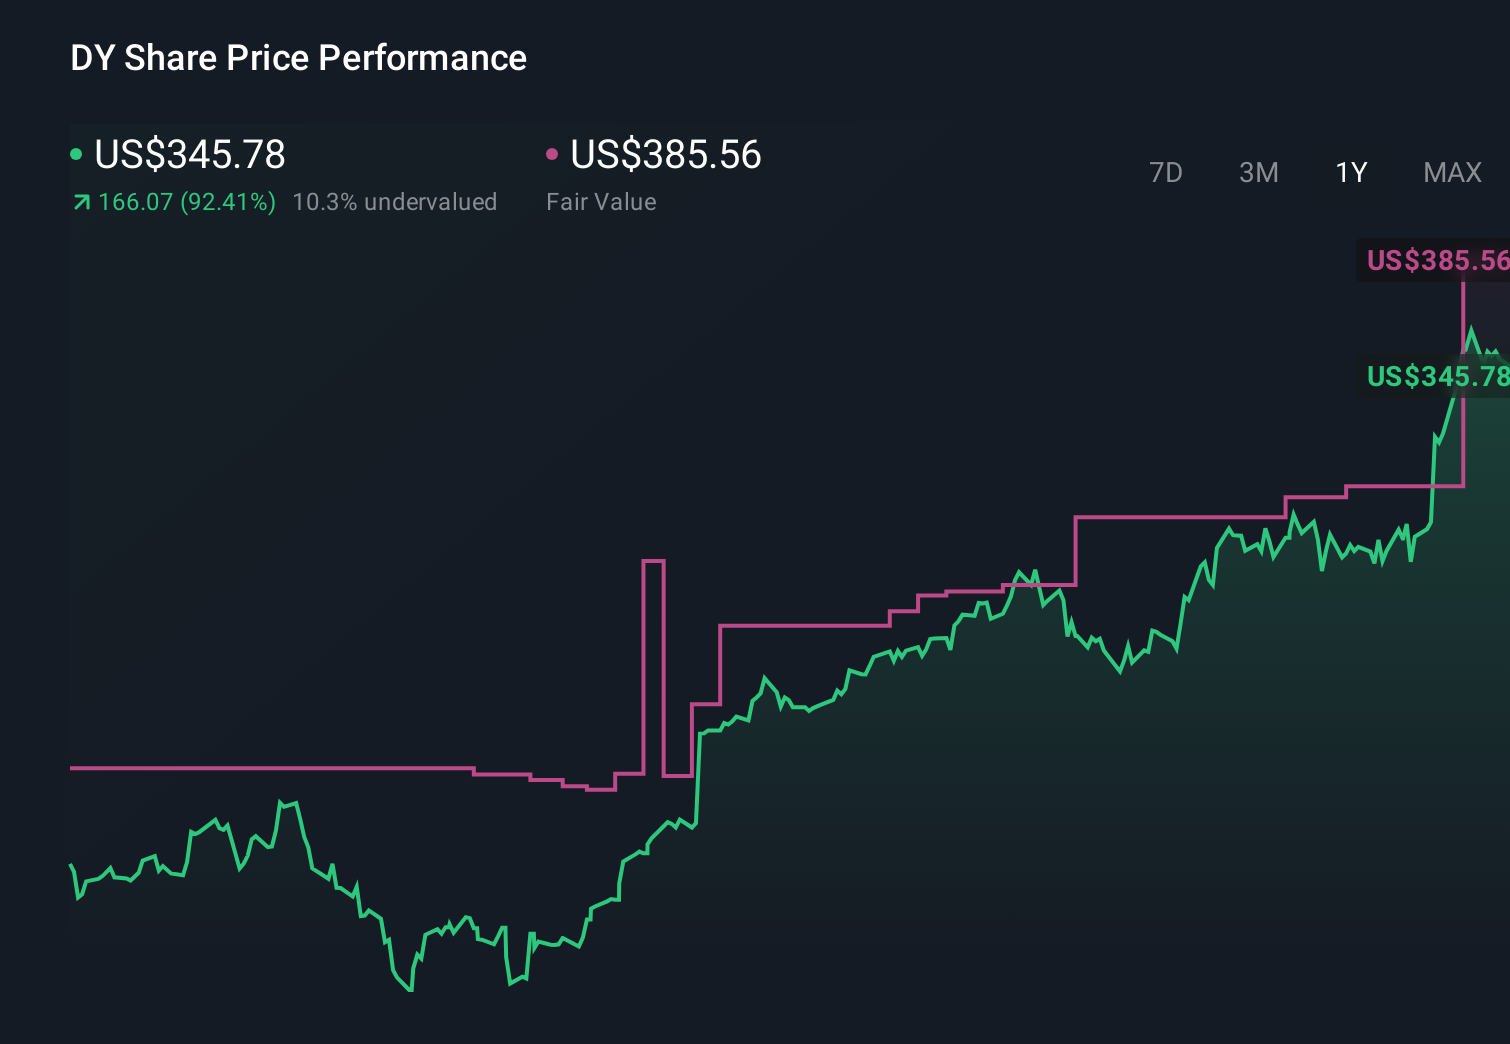
Three fair value estimates from the Simply Wall St Community span roughly US$370.92 to US$637.27, showing how far apart individual views can be. As you weigh those perspectives, remember that Dycom’s reliance on a small set of major telecom customers could have broad implications for how its recent index migration and earnings guidance ultimately play out.
Explore 3 other fair value estimates on Dycom Industries - why the stock might be worth 13% less than the current price!
The Verdict Is Yours
Don't just follow the ticker - dig into the data and build a conviction that's truly your own.
- A great starting point for your Dycom Industries research is our analysis highlighting 4 key rewards and 1 important warning sign that could impact your investment decision.
- Our free Dycom Industries research report provides a comprehensive fundamental analysis summarized in a single visual - the Snowflake - making it easy to evaluate Dycom Industries' overall financial health at a glance.
Ready For A Different Approach?
Our daily scans reveal stocks with breakout potential. Don't miss this chance:
- Invest in the nuclear renaissance through our list of 89 elite nuclear energy infrastructure plays powering the global AI revolution.
- The future of work is here. Discover the 30 top robotics and automation stocks leading the charge in AI-driven automation and industrial transformation.
- The best AI stocks today may lie beyond giants like Nvidia and Microsoft. Find the next big opportunity with these 16 smaller AI-focused companies with strong growth potential through early-stage innovation in machine learning, automation, and data intelligence that could fund your retirement.
This article by Simply Wall St is general in nature. We provide commentary based on historical data and analyst forecasts only using an unbiased methodology and our articles are not intended to be financial advice. It does not constitute a recommendation to buy or sell any stock, and does not take account of your objectives, or your financial situation. We aim to bring you long-term focused analysis driven by fundamental data. Note that our analysis may not factor in the latest price-sensitive company announcements or qualitative material. Simply Wall St has no position in any stocks mentioned.