EchoStar (ECHO) Stock After 238% One-Year Surge Is There Still Value?
EchoStar Corporation Class A ECHO | 0.00 |
- If you are trying to work out whether EchoStar stock still offers value after a strong run, the current setup makes it an interesting case to examine closely.
- The share price closed at US$97.30, with the stock down 10.9% over the last week and 20.5% over the last month, while still showing a 237.7% return over the past year and a 461.1% return over three years.
- These sharp moves follow a period where EchoStar has been attracting more attention from investors and commentators. Recent coverage has focused on how the stock's past returns compare to other media companies. This has sharpened the debate around whether the current price already reflects expectations or leaves room for a different view on value.
- EchoStar currently has a valuation score of 3 out of 6, which means it screens as undervalued on half of the checks that are run. The rest of this article will break down those methods while also pointing you to an even more complete way to look at valuation at the end.
Approach 1: EchoStar Discounted Cash Flow (DCF) Analysis
The Discounted Cash Flow model estimates what EchoStar stock could be worth by projecting future cash flows and discounting them back to today in dollar terms. It is essentially asking what those future cash flows are worth if you had them in hand now.
EchoStar currently reports last twelve month free cash flow of a loss of $2,446.02m. Analysts and estimates project this turning into positive free cash flow, with projected free cash flow of $1,910.92m in 2030. The 2 Stage Free Cash Flow to Equity model uses detailed analyst estimates for the next few years, then extrapolates further cash flows out to 2035 using Simply Wall St assumptions.
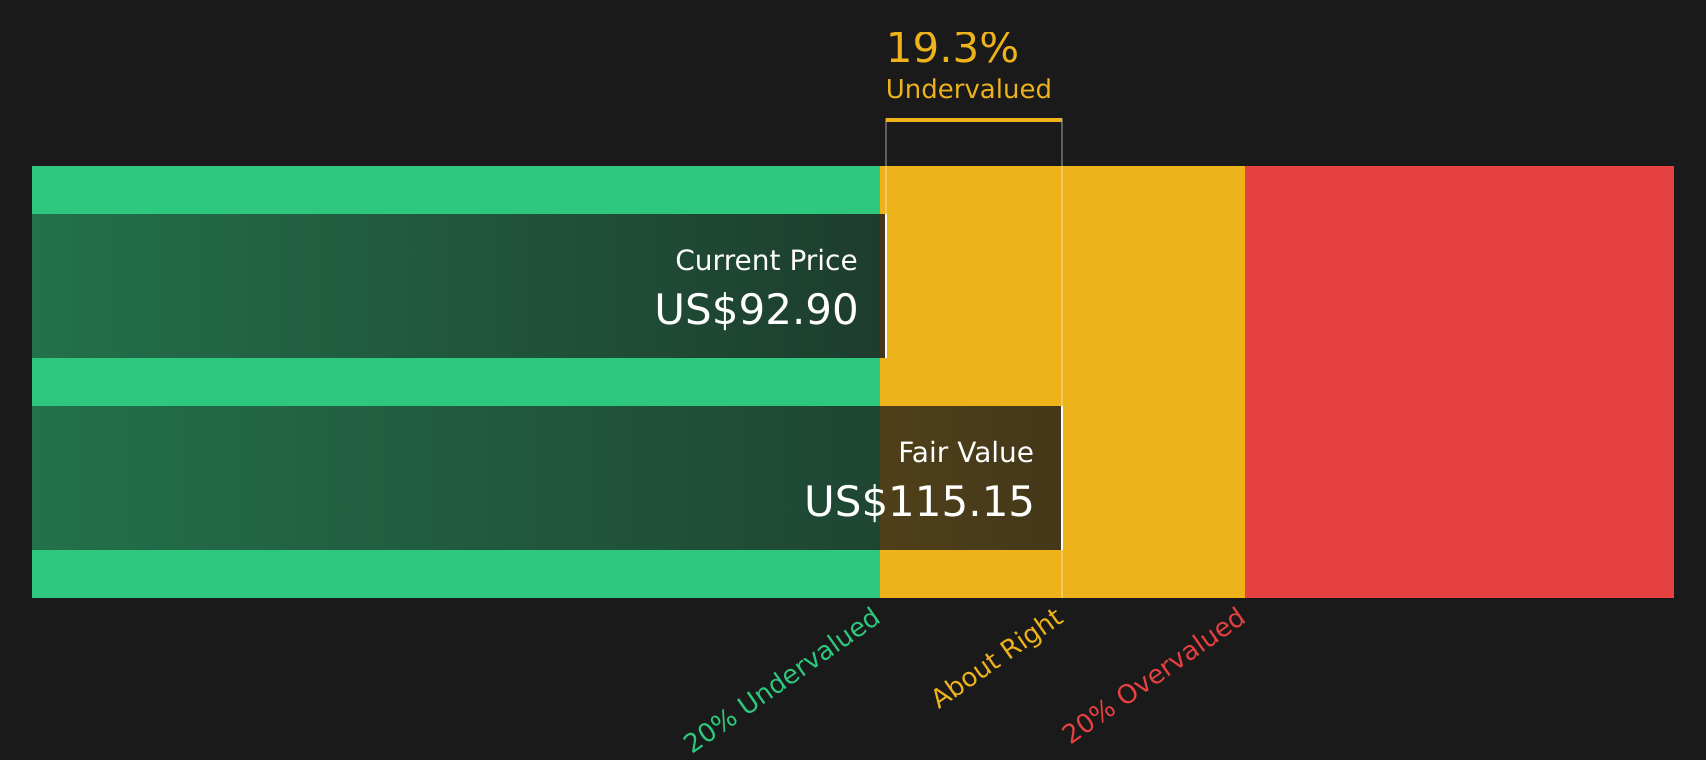
When all those projected cash flows are discounted back to today, the DCF model arrives at an estimated intrinsic value of about $109.29 per share. Compared with the recent share price of $97.30, this suggests EchoStar stock is around 11.0% undervalued on this measure.
Result: UNDERVALUED
Our Discounted Cash Flow (DCF) analysis suggests EchoStar is undervalued by 11.0%. Track this in your watchlist or portfolio, or discover 44 more high quality undervalued stocks.
Approach 2: EchoStar Price vs Sales
For EchoStar, the preferred multiple is the Price to Sales ratio. This is often useful when earnings are volatile or less meaningful, but revenue is more stable. Investors typically look for a P/S level that matches their view of a company's growth potential and risk, with higher growth and lower perceived risk often justifying a higher multiple.
EchoStar currently trades on a P/S ratio of 1.90x. This sits below the peer group average of 2.82x but above the broader Media industry average of 0.99x. Simply comparing to peers or the industry, however, does not fully reflect EchoStar's specific growth profile, margins, size, and risk.
To address that, Simply Wall St uses a proprietary "Fair Ratio" for the preferred multiple. For EchoStar, this Fair Ratio is 1.23x, which is the P/S level suggested after factoring in elements such as earnings growth, profit margins, industry, market capitalization and company specific risks. Because this Fair Ratio is meaningfully below the current P/S of 1.90x, the stock screens as overvalued on this measure.
Result: OVERVALUED

P/S ratios tell one story, but what if the real opportunity lies elsewhere? Start investing in legacies, not executives. Discover our 20 top founder-led companies.
Upgrade Your Decision Making: Choose your EchoStar Narrative
Earlier it was mentioned that there is an even better way to understand EchoStar valuation, and on Simply Wall St that takes the form of Narratives, which are short, plain language stories that link your view of the business to a set of revenue, earnings and margin forecasts and then to a Fair Value that you can compare with the current share price.
Each Narrative lives on the EchoStar Community page and turns the usual spreadsheet into something more intuitive. You see the story at the top, the forecast in the middle and the implied Fair Value at the bottom. This structure can help you decide whether the gap between price and value looks large enough to act on or small enough to wait.
Narratives are also kept up to date as new earnings, regulatory updates or news about items like spectrum deals or index changes are added to the Simply Wall St platform. This means the same story can evolve without you having to rebuild your assumptions from scratch.
For EchoStar today, for example, one investor Narrative applies a Fair Value of about US$43.91, while another sits much higher at around US$147.00, and a third is closer to the US$120.00 consensus area. This shows how different but clearly explained stories about the same company can lead to very different conclusions on value and risk.
For EchoStar however we will make it really easy for you with previews of two leading EchoStar Narratives:
These give you a quick sense of how different investors are framing the same stock so you can decide which story, if any, lines up with your own expectations and risk tolerance.
Fair value in this bullish EchoStar narrative: US$137.60
Implied discount to that fair value versus the recent US$97.30 share price: about 29.3%.
Revenue trend used in this narrative: revenue is assumed to decline about 3.5% a year.
- Focus is on EchoStar using satellite and terrestrial connectivity plus spectrum assets to build new, higher margin revenue streams while aligning with global digital inclusion programs.
- Analysts in this narrative assume today’s large losses shift to earnings of about US$1.3b by 2029, with margins improving into positive territory and the stock trading on a higher future P/E multiple.
- Key risks highlighted are heavy debt, large capital needs, regulatory decisions on spectrum, pressure in legacy Pay TV and broadband, and strong competition from other satellite and terrestrial operators.
Fair value in this more cautious EchoStar narrative: US$43.91
Implied premium to that fair value versus the recent US$97.30 share price: about 121.7%.
Revenue trend used in this narrative: revenue is assumed to decline about 2.3% a year.
- This view is built around EchoStar’s history of weak legacy financials and the idea that the market may be over extrapolating the value of its exposure to SpaceX and the broader space economy.
- The author treats EchoStar as a kind of holding vehicle for assets linked to SpaceX, using back of the envelope estimates for the SpaceX stake and net cash, then applying a discount at the holding company level.
- Potential upsides such as index inclusion and possible partnerships are acknowledged, but the core message is that sentiment and narrative shifts can run ahead of the more conservative assumptions used in this fair value estimate.
If you want to see how these and other community views translate into detailed revenue, earnings and fair value paths for EchoStar, you can review the full range of narratives on the company page, compare the assumptions, and stress test them against your own expectations before making any decisions.
Do you think there's more to the story for EchoStar? Head over to our Community to see what others are saying!

This article by Simply Wall St is general in nature. We provide commentary based on historical data and analyst forecasts only using an unbiased methodology and our articles are not intended to be financial advice. It does not constitute a recommendation to buy or sell any stock, and does not take account of your objectives, or your financial situation. We aim to bring you long-term focused analysis driven by fundamental data. Note that our analysis may not factor in the latest price-sensitive company announcements or qualitative material. Simply Wall St has no position in any stocks mentioned.