

Ellington Financial (EFC) Declares Its Monthly Dividend, Is The Stock Still Cheap?
Ellington Financial Inc. EFC | 0.00 |
Dividend announcement and why it matters for Ellington Financial
Ellington Financial (EFC) has declared a monthly dividend of $0.13 per common share, payable on August 31, 2026, to shareholders of record as of July 31, 2026. This puts the stock’s income potential in focus.
The latest dividend decision lands as Ellington Financial’s share price sits at $13.42, with a 90 day share price return of 6.59% contrasting with a year to date share price decline of 1.9%. Over a longer horizon, the stock’s total shareholder return of 13.77% over 1 year and 43.60% over 3 years points to investors having been rewarded for staying invested, even as short term share price moves around dividend dates reflect changing views on income reliability and risk.
If this income story has your attention, it can be useful to see what else is on the market and uncover 19 top founder-led companies
After Ellington Financial’s recent share price gains and with the stock still trading below some estimated values, the key issue now is whether most of the easy upside is already behind you or whether valuation still points to additional room ahead.
Price-to-Earnings of 9.2x: Is it justified?
On the latest close at $13.42, Ellington Financial screens as undervalued on earnings, with the stock described as trading at good value compared to peers, the Mortgage REITs industry and an estimated fair P/E level.
The P/E ratio compares what investors are paying for each dollar of current earnings. For a mortgage focused REIT such as Ellington Financial, this is a commonly watched gauge because the business already generates meaningful profits and investors often anchor expectations to current and near term earnings power rather than distant growth.
Ellington Financial is assessed as good value on a P/E of 9.2x versus an estimated fair P/E of 11.3x, which suggests the market is pricing its earnings at a lower level than that benchmark might imply. That same 9.2x P/E is also lower than the US Mortgage REITs industry average of 11.6x and below a peer average of 13.4x, a gap that points to the stock being valued more conservatively than many of its closest comparables.
Result: Price-to-Earnings of 9.2x (UNDERVALUED)
However, Ellington Financial’s income case could be tested if earnings weaken relative to that 9.2x P/E, or if mortgage and consumer credit conditions turn more challenging.
Another view: SWS DCF model suggests a bigger gap
While the P/E of 9.2x paints Ellington Financial as inexpensive relative to peers, our DCF model points to an estimated future cash flow value of $27.88 per share versus the current $13.42 price, indicating it is trading well below that cash flow based estimate. That kind of gap raises a simple question: which lens do you trust more when the signals differ this much?
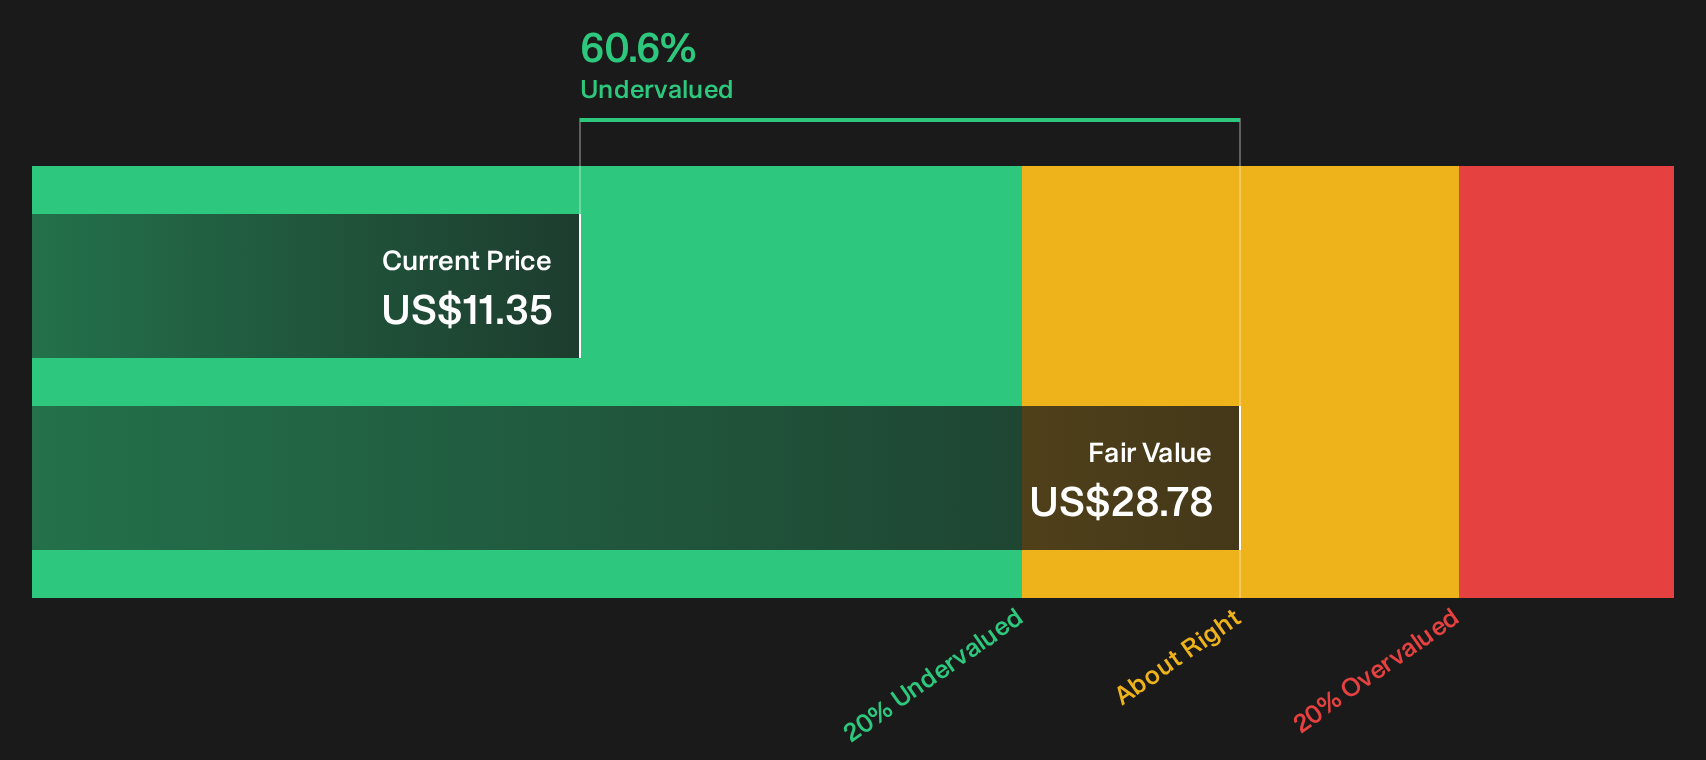
Simply Wall St performs a discounted cash flow (DCF) on every stock in the world every day (check out Ellington Financial for example). We show the entire calculation in full. You can track the result in your watchlist or portfolio and be alerted when this changes, or use our stock screener to discover 44 high quality undervalued stocks. If you save a screener we even alert you when new companies match - so you never miss a potential opportunity.
Next Steps
With mixed signals around Ellington Financial’s valuation and income profile, it makes sense to weigh both the concerns and the potential before deciding what it means for your portfolio. Take a closer look at the balance of 4 key rewards and 3 important warning signs
Looking for more Ellington Financial style investment ideas?
If Ellington Financial has sharpened your focus on valuation and income, do not stop here. Broaden your watchlist with other focused ideas that could complement your portfolio.
- Target high yield opportunities without guessing by reviewing the 9 dividend fortresses for companies offering meaningful income potential backed by specific payout data.
- Hunt for quality at a discount by scanning the 44 high quality undervalued stocks that filters for stocks combining solid fundamentals with prices below certain estimated values.
- Prioritize capital preservation and steadier profiles by assessing the 72 resilient stocks with low risk scores designed to highlight companies with relatively resilient risk scores.
This article by Simply Wall St is general in nature. We provide commentary based on historical data and analyst forecasts only using an unbiased methodology and our articles are not intended to be financial advice. It does not constitute a recommendation to buy or sell any stock, and does not take account of your objectives, or your financial situation. We aim to bring you long-term focused analysis driven by fundamental data. Note that our analysis may not factor in the latest price-sensitive company announcements or qualitative material. Simply Wall St has no position in any stocks mentioned.