

Ensign Group (ENSG) Faces New Legal Questions Following Probe Into Its Rich Valuation
Ensign Group, Inc. ENSG | 0.00 |
Legal investigation raises new questions for Ensign Group stock
Kehoe Law Firm, P.C. has opened an investigation into Ensign Group (ENSG) following allegations from short seller Muddy Waters Research about improper practices at roughly 20% of its skilled nursing facilities.
The review centers on potential breaches of fiduciary duty and regulatory oversight by certain officers and directors. For investors in Ensign Group stock, the focus now turns to how any legal or reputational fallout might relate to the company’s core skilled nursing and senior living operations.
Ensign Group shares trade at US$183.94, with recent momentum reflected in a 9.10% 1 month share price return and a 5.76% year to date share price return. At the same time, the 5 year total shareholder return of 123.04% shows a very different long term picture of investor experience.
If this legal development has you reassessing your watchlist, it can help to widen the lens beyond one healthcare operator and compare other potential opportunities through the 19 top founder-led companies
After a strong recent run and with Ensign Group trading below both analyst targets and an estimated fair value, the stock now sits at a clear valuation gap. Is that discount a warning signal or an opening?
Price-to-Earnings of 28.1x: Is it justified for Ensign Group?
On a P/E of 28.1x against a last close of $183.94, Ensign Group stock is pricing in richer expectations than both peers and the wider healthcare sector.
The P/E multiple compares the current share price with earnings per share. For a healthcare operator like Ensign Group, it reflects what investors are currently willing to pay for each dollar of earnings, relative to other stocks in the same space.
In this case, Ensign Group is described as expensive on several fronts. The stock trades at a P/E of 28.1x compared with a peer average of 16.3x and a US Healthcare industry average of 24.9x. It is also above an estimated fair P/E of 26x, a level that suggests where the market could potentially reset if enthusiasm around the earnings outlook cools. Explore the SWS fair ratio for Ensign Group
Result: Price-to-Earnings of 28.1x (OVERVALUED)
However, persistent legal scrutiny and any shift in how regulators view skilled nursing operations could quickly change how investors frame Ensign Group’s current valuation story.
Another view on Ensign Group using cash flows instead of earnings
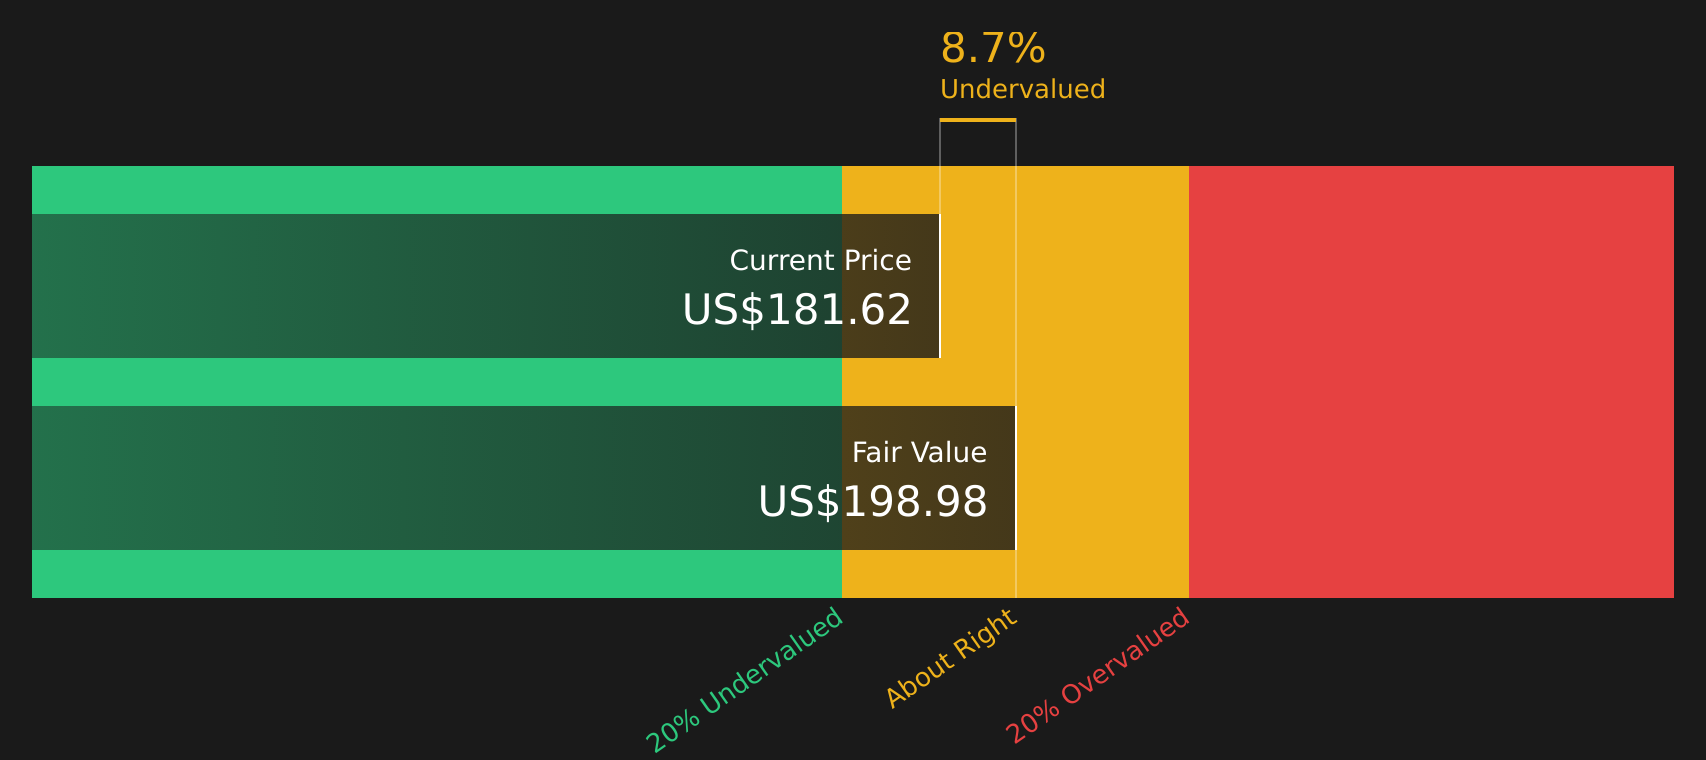
The P/E of 28.1x paints Ensign Group as expensive, but the SWS DCF model offers a different angle. On that measure, the stock at $183.94 sits about 7.6% below an estimated future cash flow value of $198.98. Is the market mispricing risk, or simply being cautious?
Simply Wall St performs a discounted cash flow (DCF) on every stock in the world every day (check out Ensign Group for example). We show the entire calculation in full. You can track the result in your watchlist or portfolio and be alerted when this changes, or use our stock screener to discover 51 high quality undervalued stocks. If you save a screener we even alert you when new companies match - so you never miss a potential opportunity.
Next Steps
With mixed signals on valuation and legal risk around Ensign Group, do you feel the balance tilts positive or negative right now? Consider reviewing the details for yourself and see why some investors still focus on its potential 3 key rewards
Looking for more investment ideas beyond Ensign Group?
If the Ensign Group situation has you reassessing your approach, now is a good time to broaden your horizons and see what other stocks might fit your style.
- Target potential mispriced opportunities by reviewing companies in the 51 high quality undervalued stocks that pair solid fundamentals with more modest expectations.
- Build a steadier income focus by checking stocks in the 9 dividend fortresses that may appeal if regular cash payouts matter to you.
- Prioritise resilience by scanning the 83 resilient stocks with low risk scores where businesses show lower overall risk scores and potentially more durable profiles.
This article by Simply Wall St is general in nature. We provide commentary based on historical data and analyst forecasts only using an unbiased methodology and our articles are not intended to be financial advice. It does not constitute a recommendation to buy or sell any stock, and does not take account of your objectives, or your financial situation. We aim to bring you long-term focused analysis driven by fundamental data. Note that our analysis may not factor in the latest price-sensitive company announcements or qualitative material. Simply Wall St has no position in any stocks mentioned.