

Enterprise Products Partners (EPD) Posted Strong Q2 Results, Is The Discount Still Justified?
Enterprise Products Partners L.P. EPD | 0.00 |
Enterprise Products Partners (EPD) has drawn fresh investor attention after reporting second quarter 2026 results, with sales of US$18,269 million and net income of US$1,841 million compared to the prior year period.
At a share price of US$37.92, Enterprise Products Partners has seen its year to date share price return rise 17.91%, while the 1 year total shareholder return of 27.21% and 5 year total shareholder return of 147.48% point to strong longer term compounding. This is despite the 90 day share price return declining 3.34% and short term momentum cooling following the recent earnings release and completion of the current buyback tranche.
If strong cash generation and infrastructure assets appeal to you, this could be a good moment to broaden your watchlist with other power grid and energy infrastructure ideas through the 36 power grid technology and infrastructure stocks
Enterprise Products Partners now trades at a meaningful discount to both internal fair value estimates and analyst targets, even after a strong run. Is the recent cooling in the unit price a warning signal or an opening for patient investors?
Most Popular Narrative: 8.1% Undervalued
At a last close of US$37.92 versus a narrative fair value of US$41.25, Enterprise Products Partners is framed as undervalued, with that view resting heavily on export-led volume growth and profitability assumptions over the next few years.
The completion of two gas processing plants in the Permian, along with several key pipeline and export terminal projects, is expected to enhance Enterprise Products Partners’ infrastructure, potentially driving revenue growth from increased volume handling and exports.
With no major planned downtimes for the PDH plants after recent maintenance, Enterprise is poised to capture additional EBITDA that was previously lost to unplanned outages, suggesting potential earnings improvement.
Want to see what sits behind that export story for Enterprise Products Partners? The fair value hinges on specific revenue growth, margin shifts and a higher future earnings multiple. Curious which of those assumptions does most of the heavy lifting in this narrative and how far they stretch current profitability expectations.
Result: Fair Value of $41.25 (UNDERVALUED)
However, investors in Enterprise Products Partners still need to watch for operational hiccups at key facilities and any unfavourable shifts in export tariffs that hit volumes.
Another View: Enterprise Products Partners Through Market Multiples
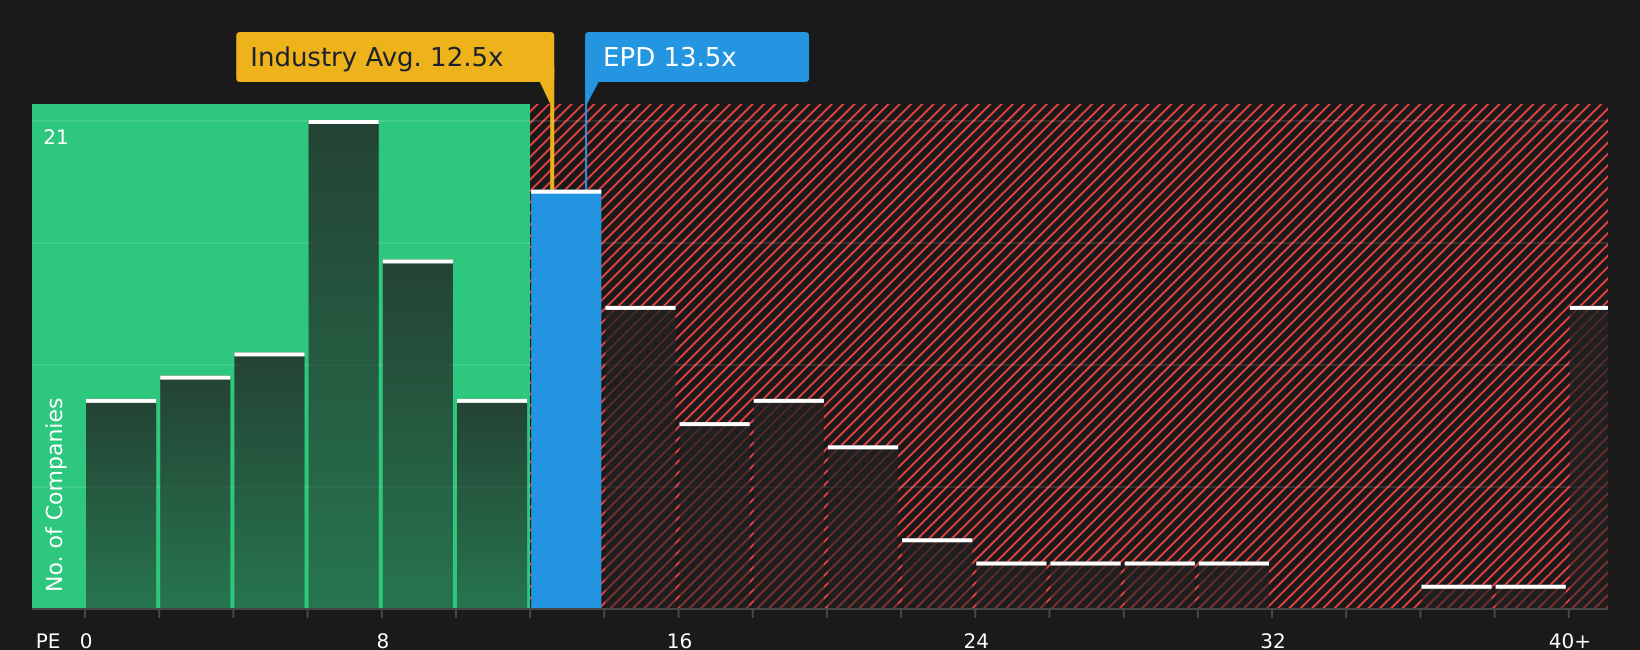
There is a different story when you look at Enterprise Products Partners through its P/E ratio. The unit price sits on 13.1x earnings, slightly above the US Oil and Gas industry at 12.7x but well below peers at 19.3x and an estimated fair ratio of 23.9x. That gap could signal mispricing or just reflect the market’s comfort level with Enterprise Products Partners’ risk and growth profile, so which side do you think it is on.
Next Steps
The Enterprise Products Partners story has been mixed so far. For a clearer view, consider acting promptly and evaluating both sides through the 3 key rewards and 2 important warning signs.
Looking for more investment ideas beyond Enterprise Products Partners?
If you stop at Enterprise Products Partners, you could miss other opportunities that fit your style. Use the screener to compare different angles and strengthen your watchlist.
- Target potential upside in quality companies that the market may be overlooking by checking out screener containing 20 high quality undiscovered gems.
- Focus on stability and sleep a little easier at night by assessing companies highlighted in the 85 resilient stocks with low risk scores.
- Build income potential into your portfolio by reviewing stocks featured in the 9 dividend fortresses.
This article by Simply Wall St is general in nature. We provide commentary based on historical data and analyst forecasts only using an unbiased methodology and our articles are not intended to be financial advice. It does not constitute a recommendation to buy or sell any stock, and does not take account of your objectives, or your financial situation. We aim to bring you long-term focused analysis driven by fundamental data. Note that our analysis may not factor in the latest price-sensitive company announcements or qualitative material. Simply Wall St has no position in any stocks mentioned.