Erie Indemnity (ERIE) Faces Mixed Valuation Signals, Is It Still Below Fair Value?
Erie Indemnity Company Class A ERIE | 0.00 |
Erie Indemnity (ERIE) remains in focus for investors after recent trading left the stock with a gain of about 3% over the past month but a decline of roughly 31% over the past year.
The recent 3.1% 30 day share price return for Erie Indemnity contrasts with a year to date share price decline of 17.2% and a 1 year total shareholder return decline of 31.2%, suggesting momentum has faded even though the 5 year total shareholder return of 30% is still positive.
If this shift in sentiment has you reassessing your portfolio, it could be a good moment to broaden your search and check out 20 top founder-led companies
With Erie Indemnity now trading below some estimates of intrinsic value and recent returns under pressure, you have to ask: is the stock quietly undervalued here, or is the market already pricing in future growth?
Preferred P/E of 21x: Is It Justified for Erie Indemnity?
On the numbers provided, Erie Indemnity screens as undervalued on one metric but expensive on another, which is why the current share price around $229.96 divides opinion.
The company is trading at a P/E of 21x, which is higher than both the specific peer group average of 13.2x and the broader US Insurance industry average of 11.5x. For an insurance services business like Erie Indemnity, the P/E ratio is a simple way to see how much investors are paying today for each dollar of current earnings.
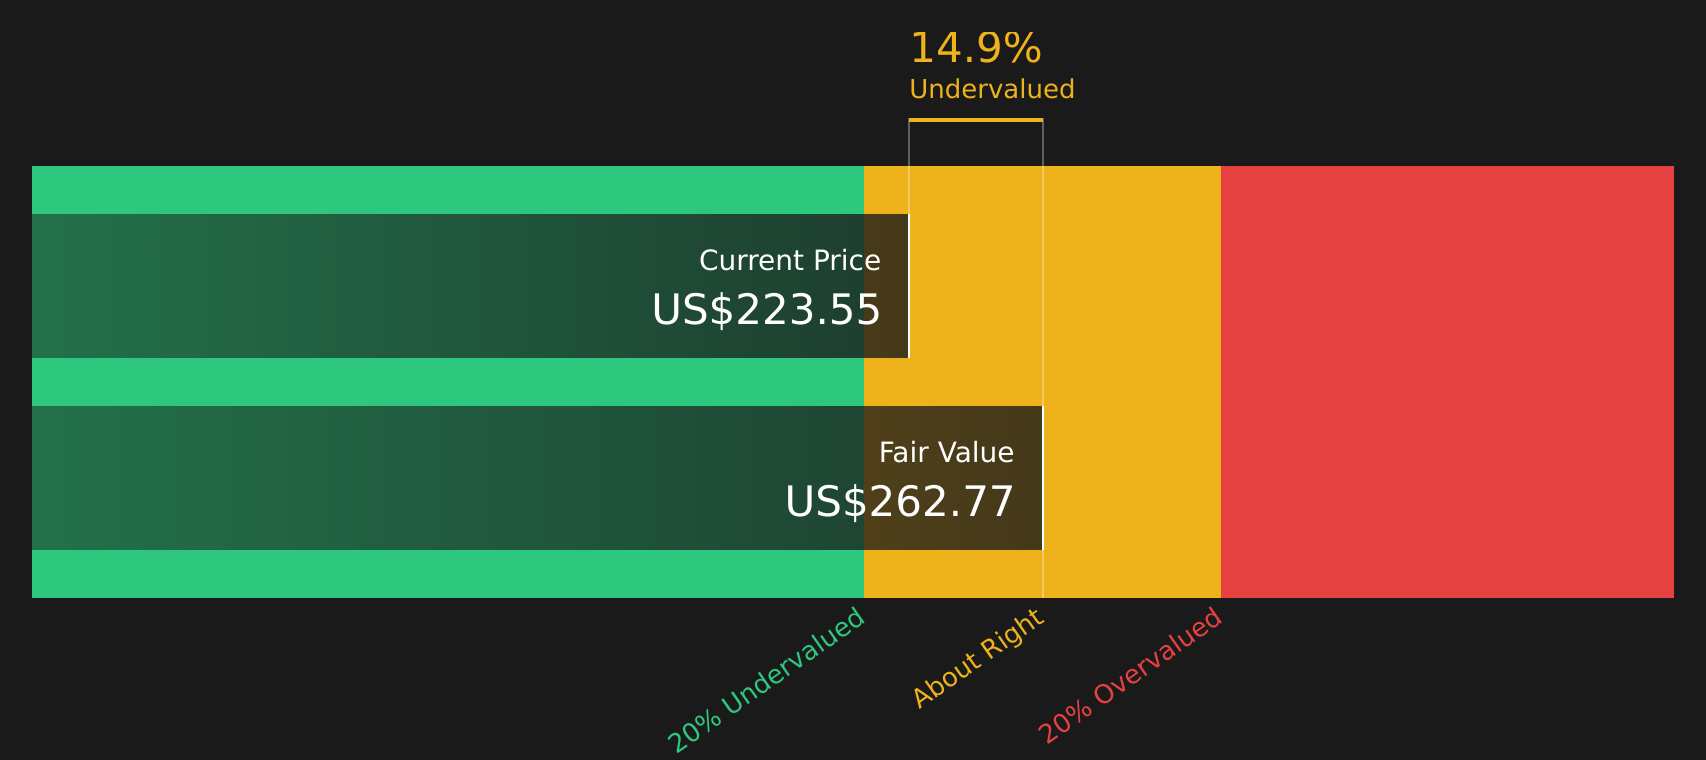
That premium multiple suggests the market is still willing to pay more for Erie Indemnity's earnings than for many insurance peers, even though earnings declined 7% over the past year and recent returns have lagged both the industry and the wider US market. At the same time, the SWS DCF model estimates a future cash flow value of $262.77 per share, which is about 12.5% above the last close, so the cash flow view and the earnings multiple are pointing in different directions.
Compared with the sector, the gap is clear, with Erie Indemnity's 21x P/E sitting well above the 11.5x industry average and the 13.2x peer group figure. That kind of spread usually reflects higher perceived quality, return on equity or resilience. ERIE has high quality earnings and a 24.3% return on equity, but investors still need to weigh that against the recent earnings decline and underperformance versus the market.
Result: Price-to-Earnings of 21x (OVERVALUED)
However, Erie Indemnity still faces risks if earnings remain under pressure or if the market decides the 21x P/E premium is no longer warranted.
Another View on Erie Indemnity’s Valuation
While Erie Indemnity looks expensive at 21x P/E versus peers, the SWS DCF model points in the opposite direction and suggests the stock is trading about 12.5% below an estimated future cash flow value of $262.77 per share. One model indicates a premium, while the other hints at a discount. Which signal should carry more weight for you?
Simply Wall St performs a discounted cash flow (DCF) on every stock in the world every day (check out Erie Indemnity for example). We show the entire calculation in full. You can track the result in your watchlist or portfolio and be alerted when this changes, or use our stock screener to discover 43 high quality undervalued stocks. If you save a screener we even alert you when new companies match - so you never miss a potential opportunity.
Next Steps
If the mixed signals around Erie Indemnity have left you unsure, it makes sense to review the underlying data yourself and decide quickly where you stand. To help frame that decision with the potential upside in mind, take a moment to review the company's 2 key rewards
Looking for more investment ideas beyond Erie Indemnity?
Do not stop with Erie Indemnity. Broaden your watchlist now and use the Simply Wall Street Screener to spot fresh stock ideas before everyone else.
- Target potential value opportunities that combine quality and attractive pricing by scanning 43 high quality undervalued stocks tailored to strong fundamentals.
- Strengthen your focus on financial resilience by reviewing companies in the solid balance sheet and fundamentals stocks screener (48 results) that prioritise robust balance sheets.
- Uncover lesser known opportunities with solid business profiles through the screener containing 19 high quality undiscovered gems that may not yet be widely followed.
This article by Simply Wall St is general in nature. We provide commentary based on historical data and analyst forecasts only using an unbiased methodology and our articles are not intended to be financial advice. It does not constitute a recommendation to buy or sell any stock, and does not take account of your objectives, or your financial situation. We aim to bring you long-term focused analysis driven by fundamental data. Note that our analysis may not factor in the latest price-sensitive company announcements or qualitative material. Simply Wall St has no position in any stocks mentioned.