

Ethereum Price At Risk As Smart Money Selling Coincides With Weak Technicals
GRAYSCALE ETHEREUM MINI TRUST ETH | 0.00 |
Ethereum (CRYPTO: ETH) price remained on edge on Sunday despite the rising odds of an extended US-Iran ceasefire. ETH was trading at $2,100, lower than this month's high of $2,450. It may be at risk of a steeper drop as smart money selling coincides with alarming technicals.
Ethereum Price May Drop Further Amid Smart Money Selling
There are signs that institutional investors are actively selling their Ethereum holdings, a sign that they expect the price to move lower in the near term.
Data shows that spot Ethereum ETFs have suffered outflows in the last 11 consecutive days. They had over $6 million in outflows on Friday, bringing the monthly outflow figure to $300 million.
These funds had over $355 million in inflows in April after experiencing outflows for five consecutive months. As a result, the cumulative net inflows have dropped to $11.6 billion. Similarly, Ethereum has had staking outflows of over $140 million in the last 30 days.
Some top altcoin ETFs have added substantial inflows this month. Ripple (CRYPTO: XRP) and Solana (CRYPTO: SOL) funds have added over $116 million and $112 million, respectively.
A likely reason why smart money investors are selling their Ethereum holdings is that its fundamentals have weakened recently. DeFi Llama data shows that the total value locked in its decentralized finance ecosystem dropped to $42 billion from a high of $91 billion in August.
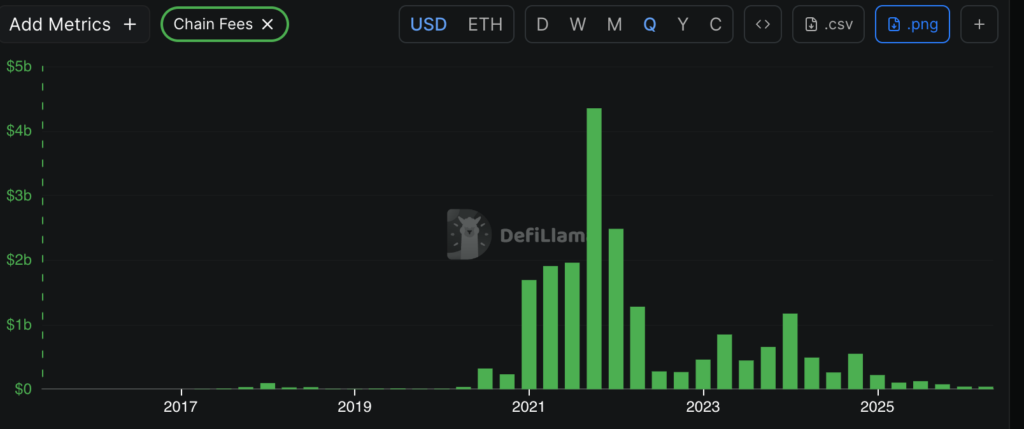
Similarly, its chain fees have tumbled this year. Ethereum made $39 million in fees last quarter, the lowest amount in years. It has been in a steady decline after peaking at $1.15 billion in the first quarter of 2024.
ETH Price Technicals Point to Further Downside
Meanwhile, technicals suggest that Ethereum price has more downside to go in the near term. It has remained below the 50-day Exponential Moving Average, a sign that bears remain in control.
The coin is also in the process of forming an inverted cup-and-handle pattern whose lower side is at $1,947. This pattern normally leads to a bearish continuation.
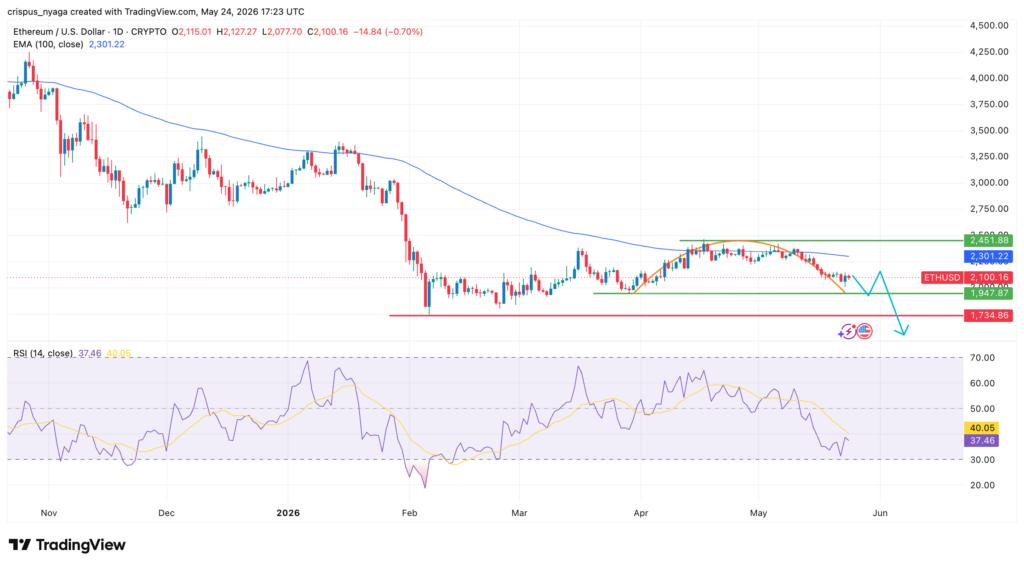
The Relative Strength Index (RSI) has also continued falling and is nearing the oversold level of 30. Therefore, the path of the least resistance is bearish, with the next key target to watch being at $1,947. Dropping below that support will point to more downside, potentially to the year-to-date low of $1,734.
Image: Shutterstock