Evaluating Northrop Grumman (NOC) Valuation After Recent Share Price Pullback
Northrop Grumman Corp. NOC | 0.00 |
Recent performance snapshot
Northrop Grumman (NOC) has seen its stock retreat, with the price down about 18% over the past month and roughly 20% over the past 3 months, closing at US$549.52.
Over a longer horizon, the stock shows a 16.5% total return over the past year and about 31.4% over 3 years, with a 59.8% total return across 5 years, offering investors a contrasting performance picture.
The recent 18.4% decline in the 30 day share price return and 19.8% decline over 90 days contrast with the 16.5% 1 year total shareholder return, suggesting recent momentum has faded after a stronger period.
If this shift in momentum has you thinking about where else capital might work hard, it could be a good moment to scan 36 power grid technology and infrastructure stocks
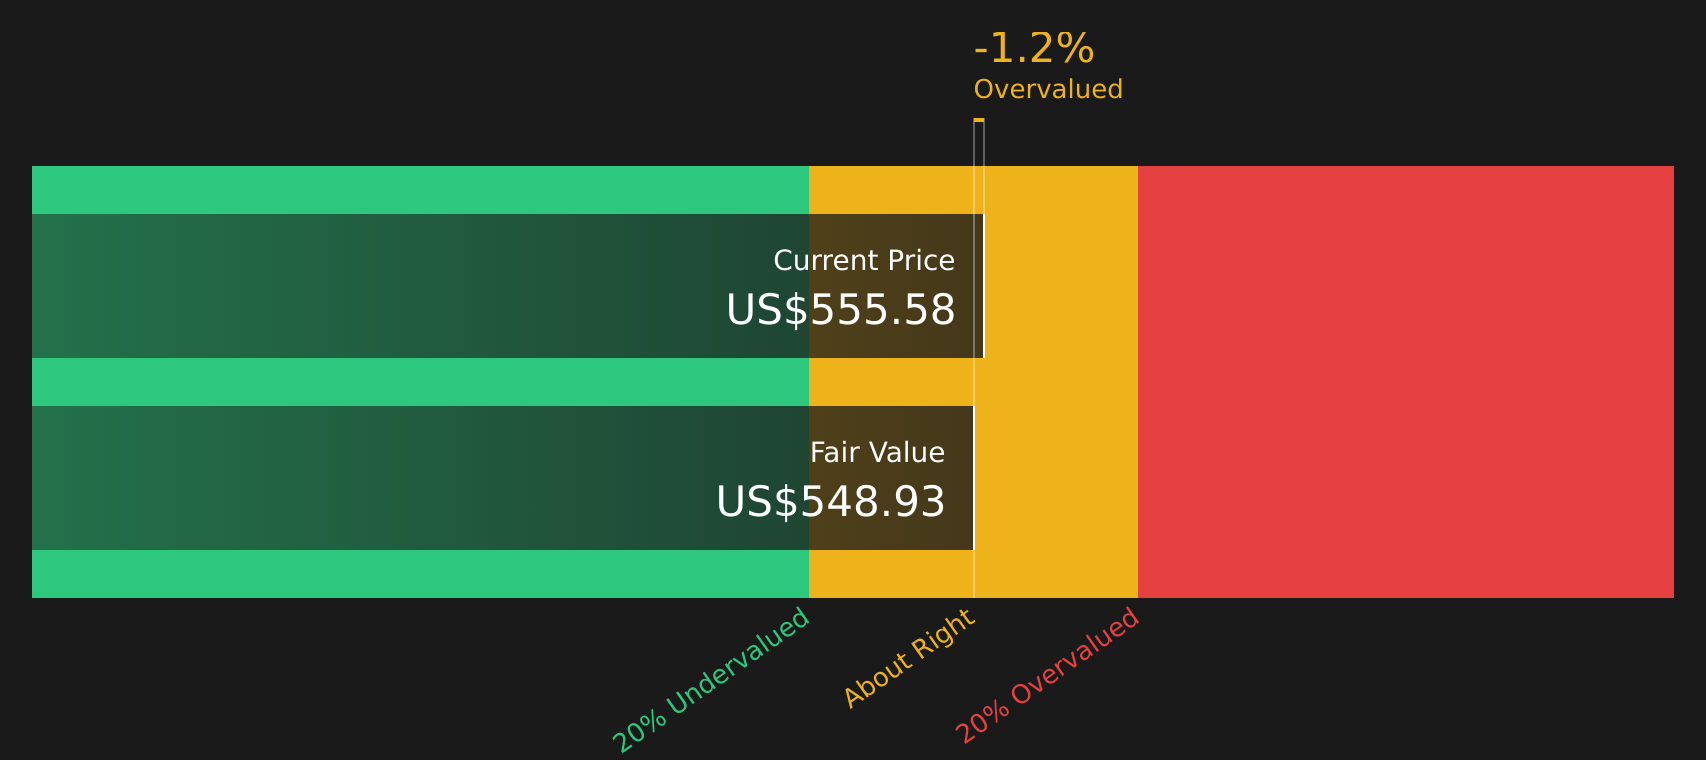
Given the recent pullback, solid 1 year to 5 year returns, and current pricing versus analyst targets and intrinsic estimates, the key question is whether Northrop Grumman is now undervalued or if the market already reflects its potential future performance.
Most Popular Narrative: 23.9% Undervalued
Northrop Grumman's most followed narrative points to a fair value of about $721.78 per share, compared with the last close at $549.52. This frames a sizeable valuation gap that rests on long term defense and space assumptions.
The ramp-up of advanced autonomous and integrated systems such as Beacon and IBCS, combined with ongoing investments in solid rocket motor capacity (targeting a near-doubling by 2029), positions the company to capitalize on high-growth, higher-margin market segments, thereby enhancing future operating margins and underlying cash flow.
Curious what kind of revenue path and margin profile could back a higher fair value than today’s price, even with only modest earnings growth baked in? The narrative leans heavily on a specific growth rate, a particular profit margin band, and a future earnings multiple that currently sits below many sector peers. All of this is stitched together with a single discount rate assumption.
Result: Fair Value of $721.78 (UNDERVALUED)
However, the narrative can quickly change if large U.S. defense programs face budget cuts or delays, or if cost overruns on fixed price contracts squeeze margins.
Another lens on valuation
The analyst narrative leans on future earnings and a higher P/E of 26.8x by 2029 to argue Northrop Grumman is undervalued at $549.52. Our SWS DCF model, which values the stock on projected cash flows, lands closer to $475.02, implying the shares are currently trading above this estimate.
When one approach flags upside and another points to premium pricing, it puts the spotlight on your own assumptions about growth, margins, and risk tolerance.
Simply Wall St performs a discounted cash flow (DCF) on every stock in the world every day (check out Northrop Grumman for example). We show the entire calculation in full. You can track the result in your watchlist or portfolio and be alerted when this changes, or use our stock screener to discover 49 high quality undervalued stocks. If you save a screener we even alert you when new companies match - so you never miss a potential opportunity.
Next Steps
With the mix of optimism and caution running through this story, it makes sense to move quickly and test the numbers yourself, then weigh up the 4 key rewards and 2 important warning signs
Looking for more investment ideas?
If Northrop Grumman is on your radar, do not stop there. Widening your opportunity set now could be the difference between a decent portfolio and a standout one.
- Spot potential value opportunities early by scanning 49 high quality undervalued stocks before others start paying attention.
- Prioritize resilience and sleep better at night by filtering for 71 resilient stocks with low risk scores that pass strict risk checks.
- Hunt for lesser-known opportunities with solid fundamentals using the screener containing 21 high quality undiscovered gems while they are still off most investors' radars.
This article by Simply Wall St is general in nature. We provide commentary based on historical data and analyst forecasts only using an unbiased methodology and our articles are not intended to be financial advice. It does not constitute a recommendation to buy or sell any stock, and does not take account of your objectives, or your financial situation. We aim to bring you long-term focused analysis driven by fundamental data. Note that our analysis may not factor in the latest price-sensitive company announcements or qualitative material. Simply Wall St has no position in any stocks mentioned.