

First Busey (BUSE) Could Be 71% Below Fair Value After Leadership Update
First Busey Corporation BUSE | 0.00 |
First Busey (BUSE) has emphasized leadership continuity by extending Van Dukeman’s role as Chairman, President, and CEO through July 1, 2029, and appointing Mike Daley as chief strategy officer.
The leadership updates at First Busey come as the stock trades at $29.31, with a 90 day share price return of 10.23% and a year to date share price return of 22.64%. The 1 year total shareholder return of 28.98% and 5 year total shareholder return of 54.43% suggest momentum has been building over a longer horizon.
If you are weighing First Busey alongside other opportunities, this can be a good moment to broaden your search and check out 18 top founder-led companies
For First Busey, a 1 year total return of 28.98% and a 5 year total return of 54.43% can reflect either firm conviction in the business or a swing in sentiment. How does the current valuation stack up against those gains?
Price-to-Earnings of 12.3x: Is it justified?
On a P/E of 12.3x, First Busey is priced very close to its estimated fair P/E of 12.2x, yet below the peer average of 14.4x.
The P/E ratio compares the company’s share price to its earnings per share and is a common way investors judge what they are paying for each dollar of profit. For a bank like First Busey, this is often used to weigh current profitability against expectations for future earnings.
Here, the stock is described as slightly expensive relative to the fair P/E level that the SWS model suggests the market could move toward. At the same time, it is considered good value relative to peers, which on average trade at a higher P/E. Against that backdrop, earnings that are forecast to grow 6.09% per year and recent profit margin improvement give some context for why the market might accept a P/E around this level compared to other US banks.
Against the broader US Banks industry, where the average P/E is 12.2x, First Busey’s 12.3x sits almost in line. This signals that the market is valuing its earnings in a very similar range to sector peers rather than assigning a steep premium or discount.
Result: Price-to-Earnings of 12.3x (ABOUT RIGHT)
However, First Busey’s narrative could be tested if revenue or net income growth of 2.92% and 6.09% fail to keep supporting current earnings expectations.
Another view on First Busey’s value
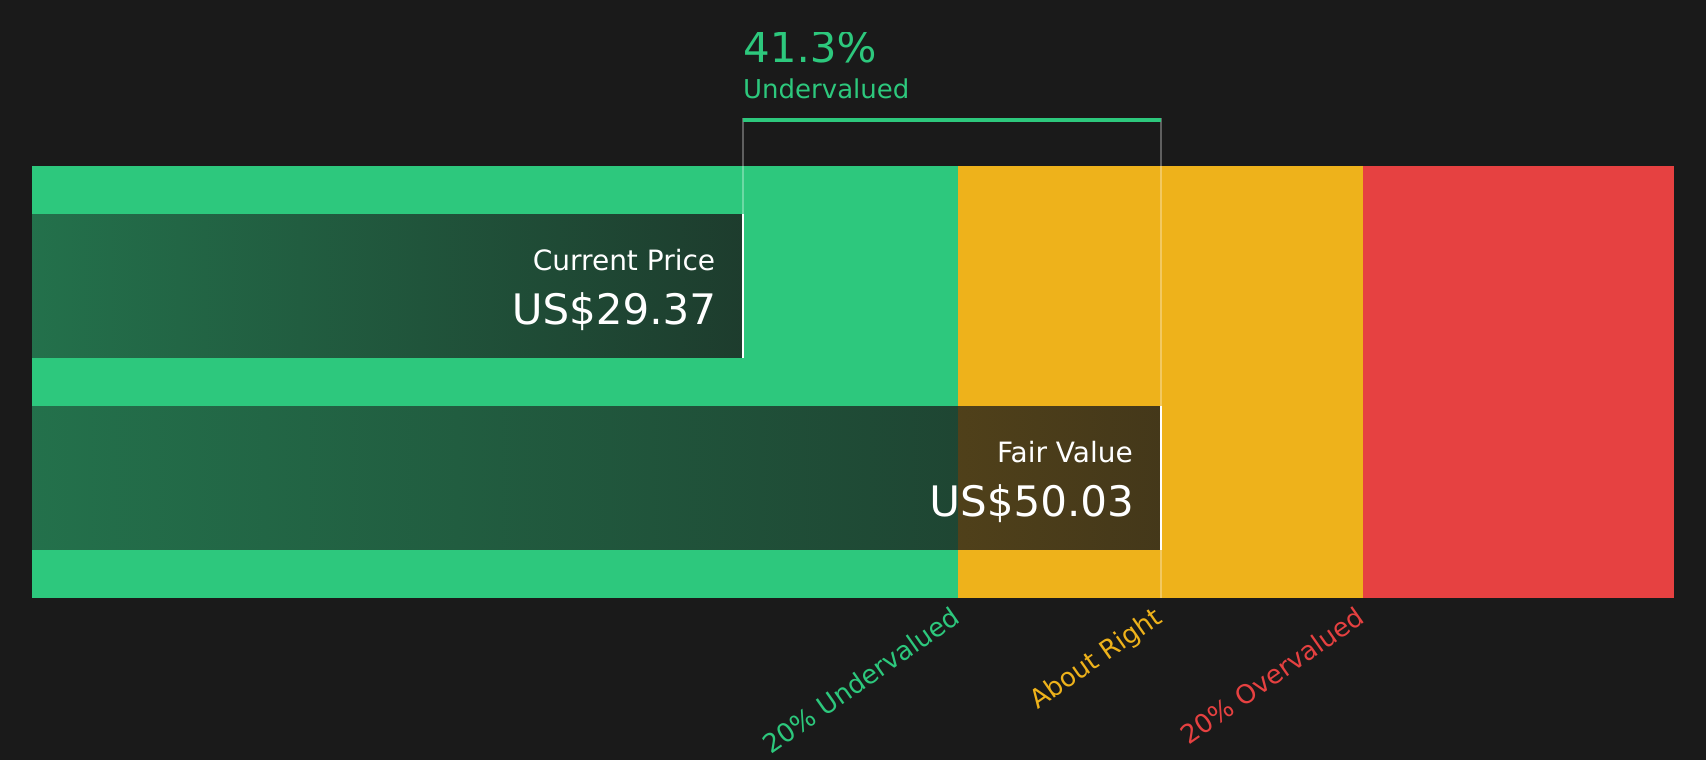
The P/E of 12.3x paints First Busey as roughly in line with peers, but the SWS DCF model tells a different story. With the stock at $29.31 and an estimated future cash flow value of $50.03, the model frames First Busey as trading at a steep discount.
The gap between price and this fair value estimate highlights potential valuation risk if cash flows fall short, but also potential upside if current assumptions hold. Which signal do you weigh more heavily when the ratio and cash flow views are pulling in different directions?
Simply Wall St performs a discounted cash flow (DCF) on every stock in the world every day (check out First Busey for example). We show the entire calculation in full. You can track the result in your watchlist or portfolio and be alerted when this changes, or use our stock screener to discover 44 high quality undervalued stocks. If you save a screener we even alert you when new companies match - so you never miss a potential opportunity.
Next Steps
With First Busey’s signals pointing in different directions, what is your read on the story so far, and how quickly do you want to act on it? To see what optimistic investors are focusing on, take a closer look at the 4 key rewards
Looking for more investment ideas beyond First Busey?
If First Busey has sharpened your focus, do not stop here. Broaden your watchlist now so you are not late to the next opportunity.
- Spot potential value plays early by checking companies in the 44 high quality undervalued stocks that pair solid fundamentals with attractive pricing signals.
- Strengthen your portfolio’s core by reviewing the solid balance sheet and fundamentals stocks screener (48 results) and focusing on businesses with resilient finances.
- Get ahead of the crowd by scanning the screener containing 20 high quality undiscovered gems before other investors start paying attention.
This article by Simply Wall St is general in nature. We provide commentary based on historical data and analyst forecasts only using an unbiased methodology and our articles are not intended to be financial advice. It does not constitute a recommendation to buy or sell any stock, and does not take account of your objectives, or your financial situation. We aim to bring you long-term focused analysis driven by fundamental data. Note that our analysis may not factor in the latest price-sensitive company announcements or qualitative material. Simply Wall St has no position in any stocks mentioned.