

Freedom Holding (FRHC) After The Antom Deal With A Pricey 62.7x P E
Freedom Holding Corp. FRHC | 0.00 |
Freedom Holding (FRHC) drew fresh investor attention after signing Memoranda of Understanding with Antom, a payment services provider under Ant International, to build cross border payment solutions for Kazakhstani users shopping on Chinese e commerce platforms.
At a share price of $151.02, Freedom Holding has pulled back slightly over the last week but still shows a 30 day share price return of 11.49% and a year to date share price return of 21.56%. Its 3 year total shareholder return of 89.70% contrasts with a 1 year total shareholder return that is down 12.57%, suggesting longer term holders have seen gains even as more recent momentum has eased.
If this cross border payments move has you thinking about where growth and risk might look different, it could be a good time to scan for 18 top founder-led companies
Freedom Holding shares have surged over the past three years yet slipped over the last twelve months, so how far does the current $151.02 price sit from a reasonable fair value range based on available estimates and fundamentals?
Price-to-Earnings of 62.7x: Is It Justified for Freedom Holding?
On the numbers available, Freedom Holding looks expensive, with a P/E of 62.7x at a share price of $151.02 compared with a peer average of 15.3x and a US Capital Markets industry average of 39.1x.
The P/E ratio compares the current share price to earnings per share. A higher P/E usually means investors are willing to pay more today for each dollar of current earnings. For a diversified financial group like Freedom Holding, a rich P/E can reflect expectations around brokerage, banking and insurance earnings, or confidence in the sustainability of recent profit growth.
Here, the P/E of 62.7x is more than 4x the peer average of 15.3x and is comfortably above the broader industry at 39.1x. This signals the market is pricing Freedom Holding at a premium relative to comparable capital markets stocks. That sits alongside the SWS DCF model outcome, which indicates the $151.02 share price is above an estimated future cash flow value of $60.29, reinforcing the picture of a stock that the data currently frame as richly valued rather than cheap.
Result: Price-to-Earnings of 62.7x (OVERVALUED)
However, investors in Freedom Holding also need to weigh risks such as its rich 62.7x P/E and heavy revenue reliance on Kazakhstan, as both could face pressure.
Another View on Freedom Holding's Valuation
Looking at Freedom Holding through the SWS DCF model, the picture also points to a rich price. The current $151.02 share price sits above an estimated future cash flow value of $60.29, which suggests limited room for error if the business underdelivers against expectations.
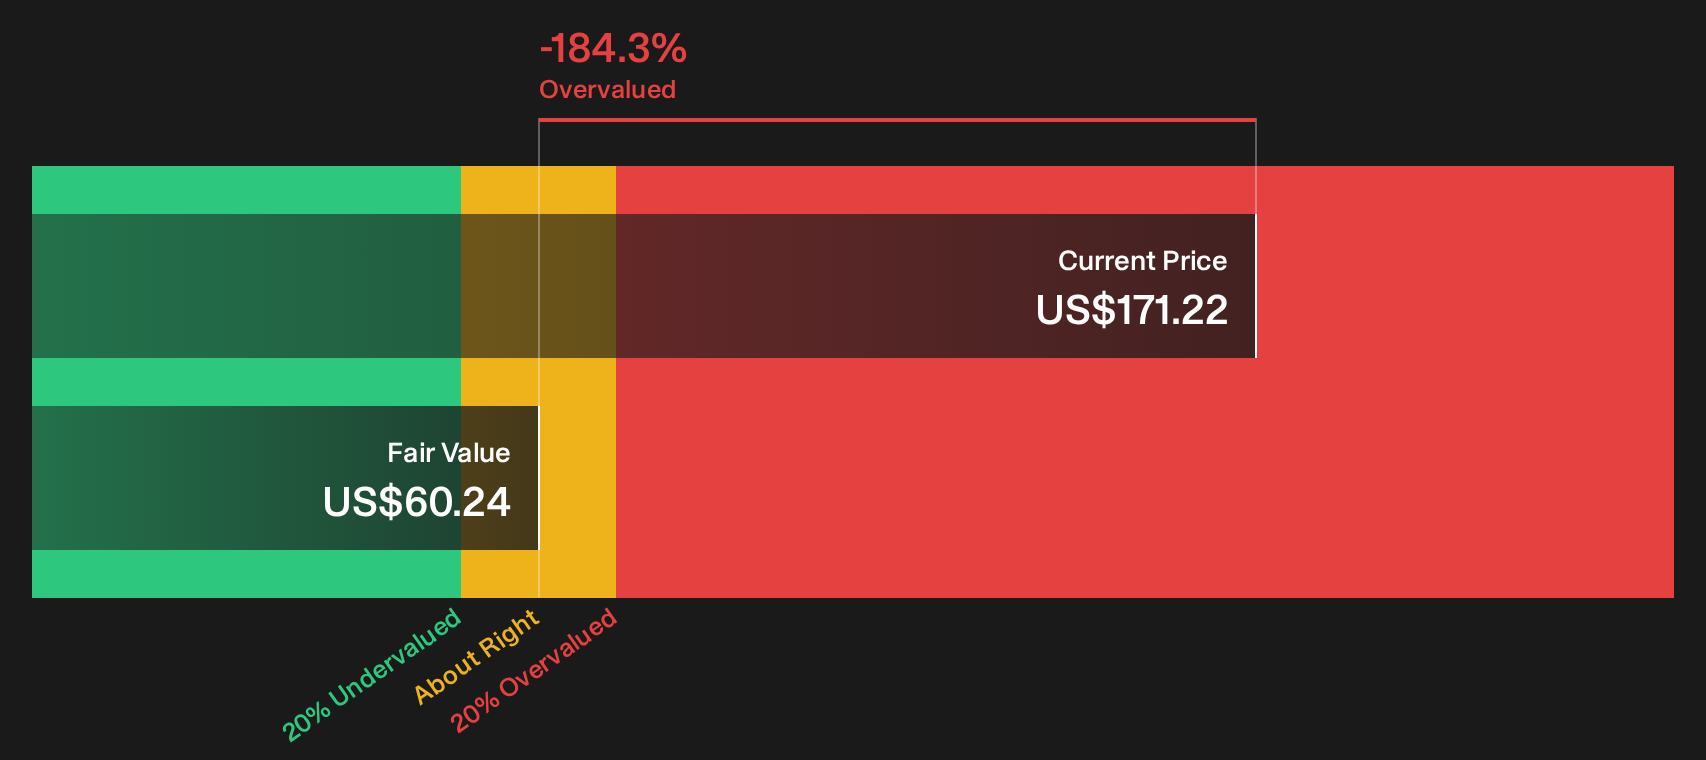
Simply Wall St performs a discounted cash flow (DCF) on every stock in the world every day (check out Freedom Holding for example). We show the entire calculation in full. You can track the result in your watchlist or portfolio and be alerted when this changes, or use our stock screener to discover 49 high quality undervalued stocks. If you save a screener we even alert you when new companies match - so you never miss a potential opportunity.
Next Steps
With Freedom Holding priced richly on both earnings and cash flow measures, the real question is how you weigh its potential against its risks and rewards. Move quickly from headline impressions and stress test your own thesis by starting with 1 key reward and 3 important warning signs
Looking for more investment ideas beyond Freedom Holding?
Once you have formed a view on Freedom Holding, do not stop there. Broaden your watchlist with other stocks that align more closely with your risk and return preferences.
- Target potential mispricings by scanning a curated list of 49 high quality undervalued stocks that pair earnings strength with balance sheet support.
- Prioritise resilience by reviewing 81 resilient stocks with low risk scores that may suit investors who want steadier profiles across different market conditions.
- Hunt for future leaders early by checking the screener containing 20 high quality undiscovered gems before wider attention moves prices away from your comfort zone.
This article by Simply Wall St is general in nature. We provide commentary based on historical data and analyst forecasts only using an unbiased methodology and our articles are not intended to be financial advice. It does not constitute a recommendation to buy or sell any stock, and does not take account of your objectives, or your financial situation. We aim to bring you long-term focused analysis driven by fundamental data. Note that our analysis may not factor in the latest price-sensitive company announcements or qualitative material. Simply Wall St has no position in any stocks mentioned.