Grainger (GWW) Margin Compression Reinforces Bearish Narrative Despite Solid Revenue Base
W.W. Grainger, Inc. GWW | 1117.45 | +0.89% |
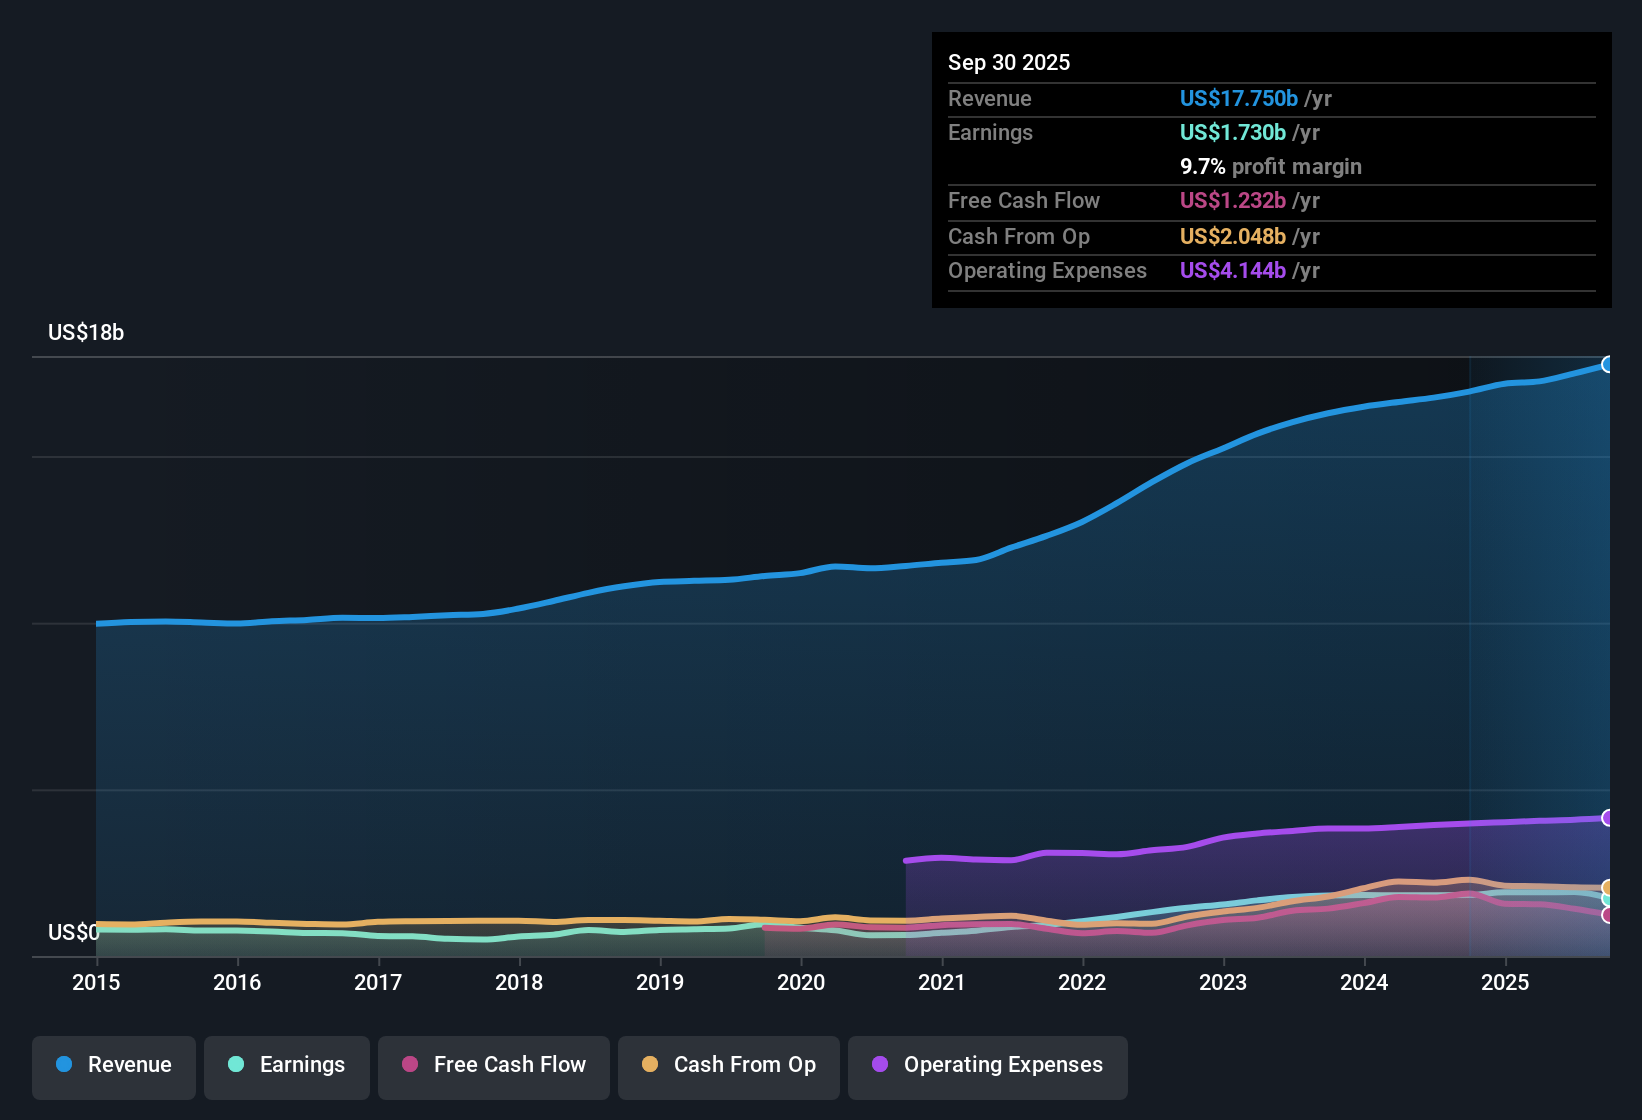
W.W. Grainger (GWW) opened FY 2025 with third quarter revenue of US$4.7b and basic EPS of US$6.15, set against a trailing twelve month line of US$17.8b in revenue and EPS of US$35.93. The company has seen quarterly revenue move from US$4.31b in Q2 2024 to US$4.55b in Q2 2025, and from US$4.39b in Q3 2024 to US$4.66b in Q3 2025, while basic EPS has ranged from roughly US$9.59 to US$10.04 across those prior quarters. With a net margin that has eased from 10.8% to 9.7% over the last year, this latest print puts the focus squarely on how effectively Grainger is converting that higher revenue base into profit.
See our full analysis for W.W. Grainger.With the headline numbers on the table, the next step is to see how this earnings run rate lines up with the prevailing growth and risk narratives that investors have been following around Grainger.
Margins Softening With 9.7% Net Profit Level
- On a trailing twelve month basis, Grainger converted US$17.8b of revenue into US$1.7b of net income, which equates to a 9.7% net margin compared with 10.8% in the prior year.
- What stands out for a cautious, bearish view is that this softer margin appears alongside solid scale, with quarterly net income moving from US$486 million in Q3 2024 to US$294 million in Q3 2025. This can feed concerns that profitability is under pressure even as revenue holds near US$4.7b.
- This pattern gives bears a concrete data point to support worries about cost pressure or pricing power when they look at the last year in aggregate.
- At the same time, the fact that trailing twelve month net income is still about US$1.7b challenges any extreme bearish claim that profitability has collapsed, because the business remains solidly in the black.
Valuation Premium Versus DCF And Peers
- Grainger trades at a P/E of 31.7x versus a peer average of 23.7x, with a DCF fair value cited at about US$972.53 compared with the current share price of roughly US$1,155.
- Critics highlight this gap as a bearish point, arguing that paying above both the 23.7x peer multiple and the US$972.53 DCF fair value stretches expectations, especially when trailing twelve month EPS is US$35.93 and has eased from US$39.71 a quarter earlier.
- This combination of a richer multiple and DCF discount heavily supports the bearish case that the market is already factoring in a lot of future progress.
- However, the fact that five year earnings growth has averaged 17.9% per year means the long run track record does not neatly fit a simple overvaluation story, since that history helps explain why investors might accept a premium in the first place.
Moderate Growth Forecasts After Strong Five Year Run
- Over the past five years, earnings have grown about 17.9% per year, while current forecasts call for roughly 7.2% annual earnings growth and about 6.5% annual revenue growth, both described as below broad US market forecasts.
- Supporters of a more bullish angle point to that 17.9% five year earnings growth as evidence that Grainger has managed to grow consistently. However, the recent trailing twelve month step down in earnings from US$1.9b to about US$1.7b and the lower 7.2% earnings growth outlook leave less room for an aggressive growth story.
- This mix of strong historical growth with more measured forecasts can still support a bullish argument for durability, especially when quarterly revenue has held in a tight band from US$4.3b to US$4.7b across the last six quarters.
- At the same time, the moderation in growth expectations gives skeptics ammunition to say that the past 17.9% rate is not the right yardstick for what comes next, especially when net margin has moved from 10.8% to 9.7% over the last year.
Next Steps
Don't just look at this quarter; the real story is in the long-term trend. We've done an in-depth analysis on W.W. Grainger's growth and its valuation to see if today's price is a bargain. Add the company to your watchlist or portfolio now so you don't miss the next big move.
See What Else Is Out There
Grainger is carrying a premium P/E versus peers, a DCF value below the current share price, softening margins and a recent step down in earnings.
If that mix feels tight for your comfort, use our these 873 undervalued stocks based on cash flows to quickly zero in on companies where pricing looks more reasonable relative to their cash flow profiles.
This article by Simply Wall St is general in nature. We provide commentary based on historical data and analyst forecasts only using an unbiased methodology and our articles are not intended to be financial advice. It does not constitute a recommendation to buy or sell any stock, and does not take account of your objectives, or your financial situation. We aim to bring you long-term focused analysis driven by fundamental data. Note that our analysis may not factor in the latest price-sensitive company announcements or qualitative material. Simply Wall St has no position in any stocks mentioned.