Harley-Davidson (HOG) Q4 Loss Challenges Bullish Earnings Resilience Narratives
Harley-Davidson, Inc. HOG | 22.86 22.54 | -1.34% -1.40% Post |
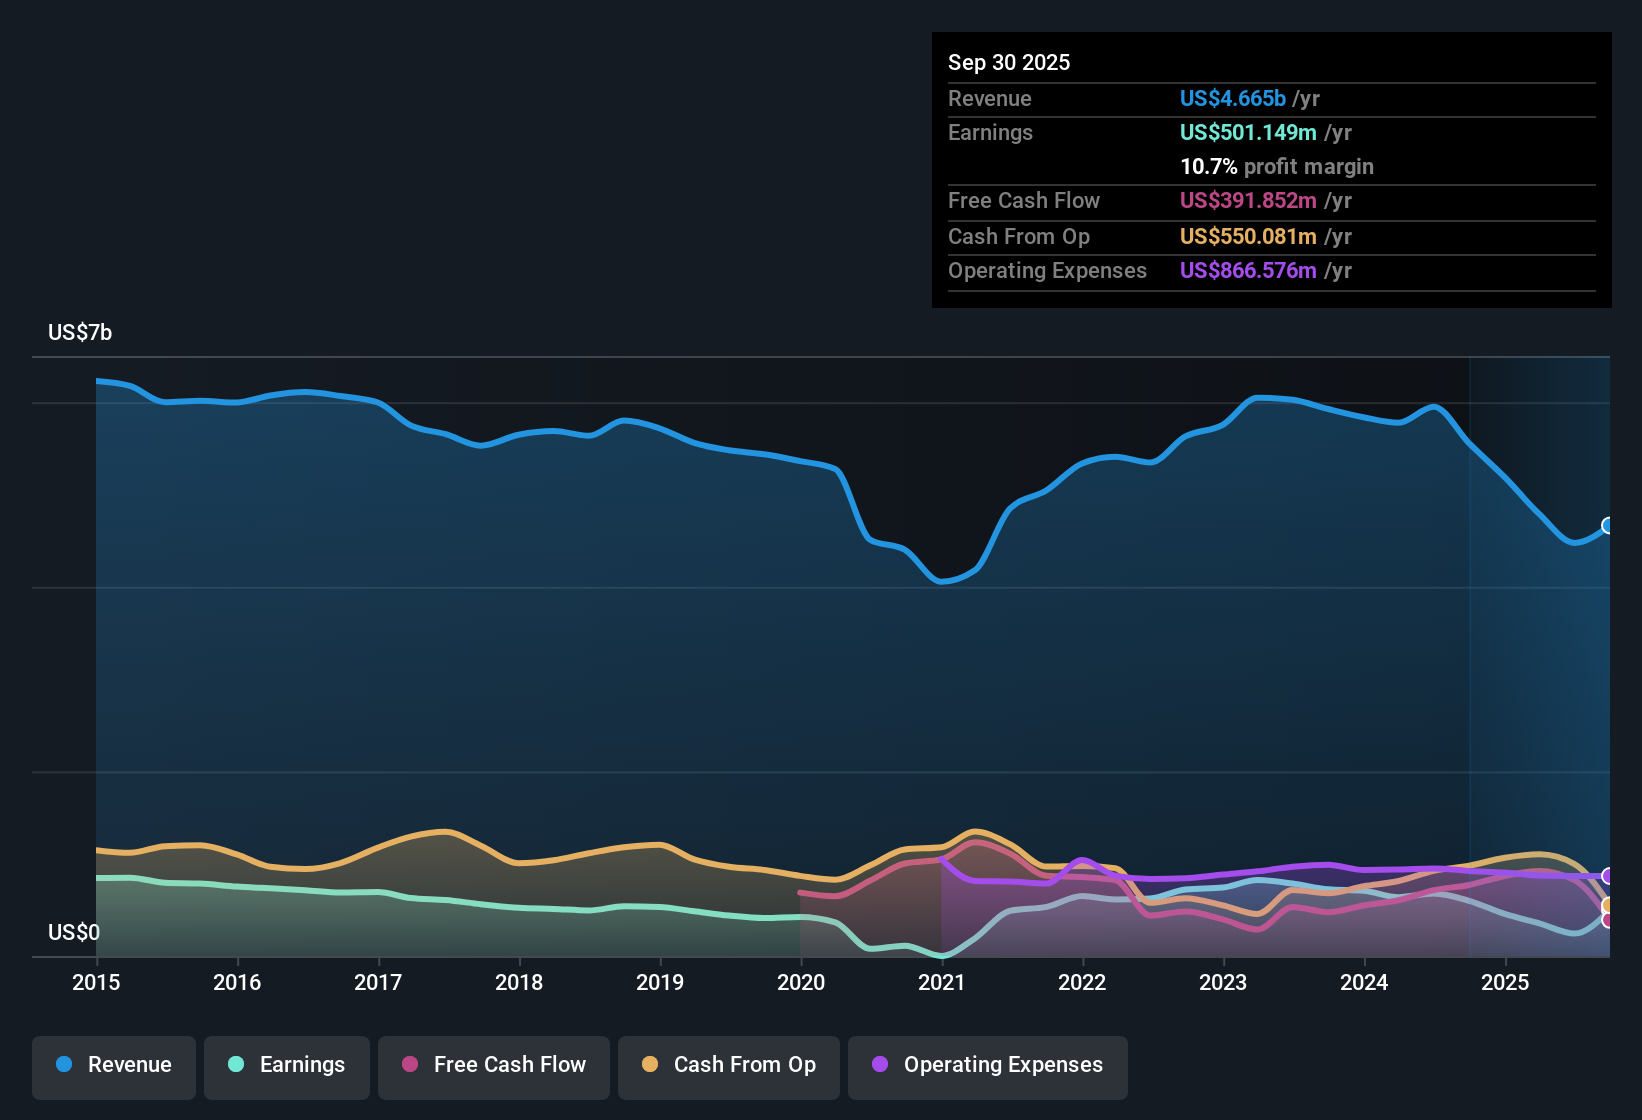
Harley-Davidson (HOG) has wrapped up FY 2025 with a bumpy finish, as Q4 revenue came in at US$496.2 million and the company reported a loss per share of US$2.44, compared to a Q3 stretch that featured US$1.3 billion in revenue and EPS of US$3.13. Over the past few quarters, revenue has moved from US$1.3 billion in Q1 2025, to US$1.3 billion in Q2 and US$1.3 billion in Q3, before easing back to US$496.2 million in Q4. EPS ranged from US$1.07 in Q1 to US$0.89 in Q2 and US$3.13 in Q3, and then into loss territory in Q4, setting up a mixed read on Harley-Davidson’s margin story and future earnings power.
See our full analysis for Harley-Davidson.With the headline numbers on the table, the next step is to see how this earnings profile lines up with the big narratives around Harley-Davidson, and where the latest margin and growth signals push back against those stories.
TTM profit of US$338.7 million vs Q4 loss
- Across the last twelve months, Harley-Davidson earned US$338.7 million in net income and US$2.82 in EPS, even though Q4 alone showed a net loss of US$279.3 million and a loss per share of US$2.44.
- Bulls argue that earnings power can hold up even when individual quarters are weak, and the numbers partly support that view:
- Trailing 12 month net margin sits at 7.6%, compared with 8.8% a year ago, so profitability is still positive but not as strong as before.
- Analysts are forecasting around 8.8% annual earnings growth while also expecting revenue to decline about 2.9% a year. This sets a high bar for the bullish view that cost programs and mix can offset softer sales.
Margins slip from 8.8% to 7.6%
- Net profit margin over the last year is 7.6%, down from 8.8% in the prior year, and the latest quarter swung to a loss of US$279.3 million on US$496.2 million of revenue.
- Bears focus on the pressure this puts on the business model, and the data gives them some support:
- Expected revenue decline of about 2.9% per year over the next three years, combined with the lower margin, aligns with the cautious view that unit volumes and pricing are under strain.
- An unstable dividend record and recent insider selling also sit awkwardly next to weaker margins, which critics see as signals that cash returns and confidence are not on a firmly rising path right now.
Low 7.3x P/E and DCF fair value gap
- At a share price of US$20.94, Harley-Davidson trades on a P/E of 7.3x, compared with 19.7x for the global auto industry and 24.9x for peers, and below a DCF fair value of about US$29.36.
- Supporters of the company’s valuation story point to this gap, but the fundamentals add some tension:
- The stock sits roughly 28.7% below the DCF fair value estimate, yet trailing 12 month earnings have fallen from US$501.1 million a year ago to US$338.7 million now, which helps explain why the market is cautious.
- Analysts also expect revenue to contract over the next few years, so any case that the low P/E and discount to DCF fair value signal a clear bargain has to address those softer top line expectations.
Next Steps
To see how these results tie into long-term growth, risks, and valuation, check out the full range of community narratives for Harley-Davidson on Simply Wall St. Add the company to your watchlist or portfolio so you'll be alerted when the story evolves.
See the numbers differently? Take a couple of minutes to test your own view against the data and shape a story that fits your thesis, then Do it your way
A great starting point for your Harley-Davidson research is our analysis highlighting 3 key rewards and 2 important warning signs that could impact your investment decision.
See What Else Is Out There
Harley-Davidson is working through weaker margins, a recent quarterly loss and softer revenue expectations, which together raise questions about earnings resilience and risk.
If those pressure points make you cautious about concentration risk, it is worth checking companies in 83 resilient stocks with low risk scores so you can quickly size up steadier options.
This article by Simply Wall St is general in nature. We provide commentary based on historical data and analyst forecasts only using an unbiased methodology and our articles are not intended to be financial advice. It does not constitute a recommendation to buy or sell any stock, and does not take account of your objectives, or your financial situation. We aim to bring you long-term focused analysis driven by fundamental data. Note that our analysis may not factor in the latest price-sensitive company announcements or qualitative material. Simply Wall St has no position in any stocks mentioned.