Honeywell (HON) Stock Weighs Aerospace Spin Plans Against Fair Value Around $229
Honeywell International Inc. HON | 0.00 |
- If you are wondering whether Honeywell International at around US$229 per share is offering good value today, the key is to look past the headline price and understand what the underlying valuation is really telling you.
- Over shorter periods the stock has recorded returns of 4.5% over 7 days, 5.5% over 30 days, 16.9% year to date, 11.9% over 1 year, 29.2% over 3 years and 23.9% over 5 years, which can influence how investors think about both opportunity and risk.
- Recent coverage around Honeywell International has focused on its position as a diversified industrial and technology company, with investors paying attention to how its mix of businesses may influence long term demand and capital allocation decisions. This context helps frame how the market is reacting to new information and why the share price can move even without a single defining headline.
- On Simply Wall St's 6-point valuation framework, Honeywell International currently scores 1 out of 6. The next sections will compare what different valuation methods say about that score and then finish with a broader way to think about whether the stock fits your own view of value.
Honeywell International scores just 1/6 on our valuation checks. See what other red flags we found in the full valuation breakdown.
Approach 1: Honeywell International Discounted Cash Flow (DCF) Analysis
A Discounted Cash Flow, or DCF, model estimates what Honeywell International might be worth today by projecting future cash flows and discounting them back to a present value using a required rate of return. It focuses on what the business can generate in cash, rather than just current earnings or revenue multiples.
For Honeywell International, the latest twelve month free cash flow is about $4.2b. Analysts have provided detailed forecasts for several years ahead, and those projections, combined with Simply Wall St extrapolations, point to free cash flow of about $7.7b in 2030. The model used here is a 2 Stage Free Cash Flow to Equity approach, which captures an initial period guided by analyst estimates and then a longer phase based on more moderate growth assumptions.
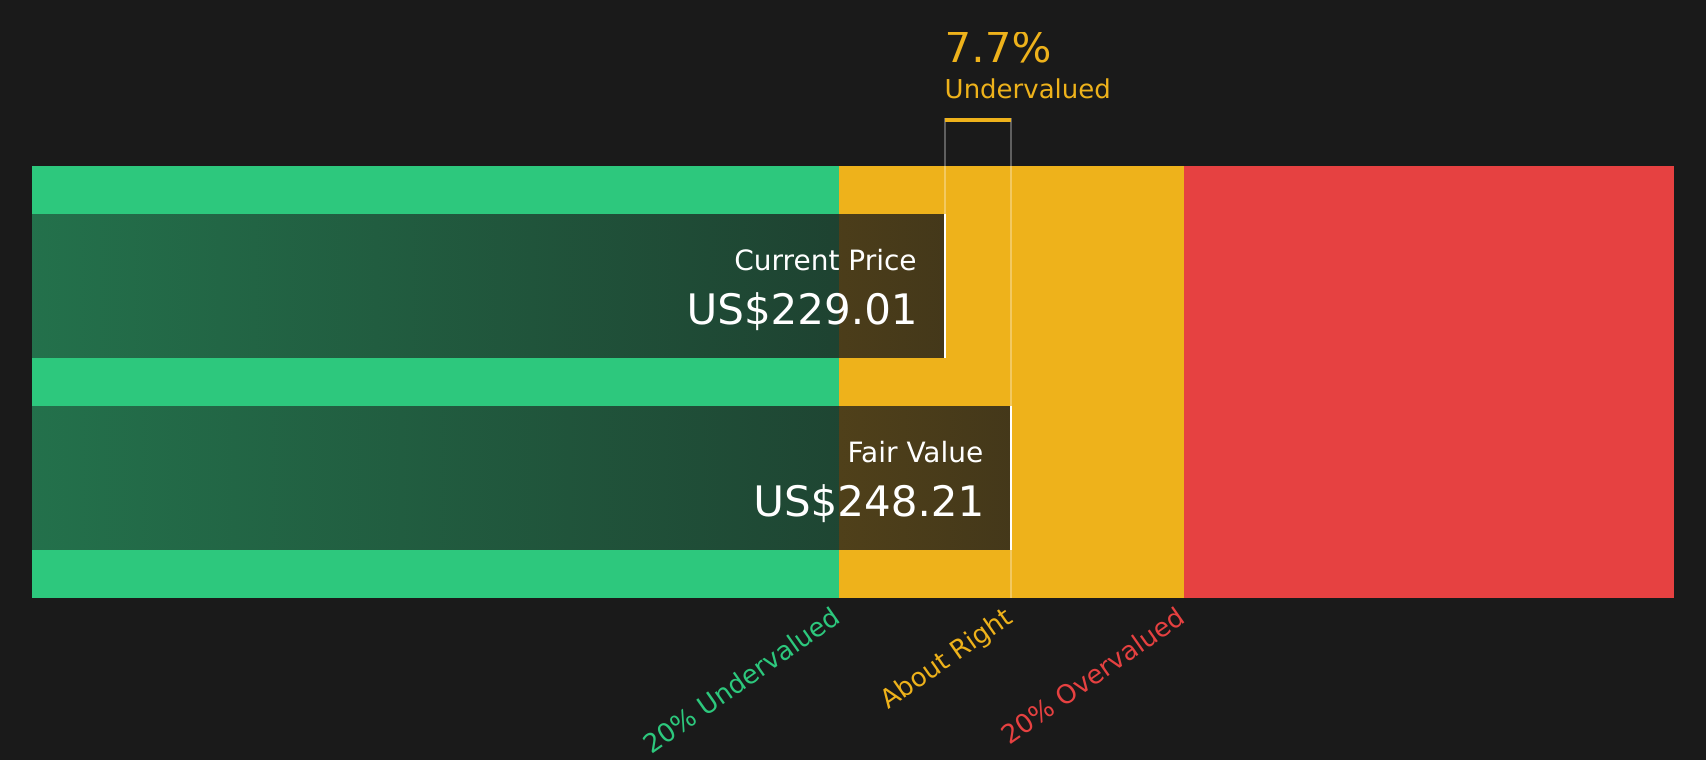
Bringing all those projected cash flows back to today, the DCF model suggests an intrinsic value of about $248.30 per share, compared with the recent share price around $229. This implies the stock trades at roughly a 7.8% discount to the model estimate of fair value.
Result: ABOUT RIGHT
Honeywell International is fairly valued according to our Discounted Cash Flow (DCF), but this can change at a moment's notice. Track the value in your watchlist or portfolio and be alerted on when to act.
Approach 2: Honeywell International Price vs Earnings
For a profitable company like Honeywell International, the P/E ratio is a useful way to relate what you pay for the stock to what the business currently earns. It helps you see how many dollars investors are paying today for each dollar of earnings.
What counts as a “normal” or “fair” P/E depends on expectations for future growth and the level of risk investors see in those earnings. Higher expected growth or lower perceived risk usually supports a higher P/E, while slower growth or higher risk tends to justify a lower one.
Honeywell International currently trades on a P/E of about 36.6x. That is above the Industrials sector average of about 13.2x and also higher than the peer group average of about 32.6x. Simply Wall St’s Fair Ratio for Honeywell International is 36.4x. This is a proprietary estimate of what the P/E could be given factors such as earnings growth, industry, profit margins, market cap and risk profile. This Fair Ratio can be more tailored than a simple comparison with peers or sector averages, because it adjusts for the specific characteristics of the company. With the actual P/E very close to the Fair Ratio, the stock appears broadly in line with this framework.
Result: ABOUT RIGHT

P/E ratios tell one story, but what if the real opportunity lies elsewhere? Start investing in legacies, not executives. Discover our 20 top founder-led companies.
Upgrade Your Decision Making: Choose your Honeywell International Narrative
Earlier it was mentioned that there is an even better way to understand valuation, so on Simply Wall St you can use Honeywell International Narratives to connect your view of the company with a financial forecast and a fair value estimate that sits behind the share price.
A Narrative is simply your story about Honeywell International written into the numbers. You set assumptions for future revenue, earnings and margins, then see what you think the stock is worth based on those inputs rather than only relying on a single DCF or P/E screen.
Each Narrative links three pieces together in one place: the business story you believe in, the forecast that reflects it, and the fair value output that you can compare to the current price to decide whether Honeywell International looks expensive or not on your terms.
These Narratives live on the Simply Wall St Community page and are designed to be easy to use. The platform already hosts millions of investors who can publish and review different Honeywell International views without needing to build their own model from scratch.
Because Narratives update when new information like earnings, guidance or news is added, your Honeywell International fair value view does not sit frozen in time. It adjusts as the data feeding your assumptions changes.
For example, one Honeywell International Narrative currently applies a fair value of about US$199.69 per share using relatively cautious assumptions, while another applies about US$296.00 per share using more optimistic assumptions. This shows how two investors looking at the same stock can reach very different conclusions once they spell out their story in numbers.
For Honeywell International, however, we will make it really easy for you with previews of two leading Honeywell International Narratives:
On Simply Wall St you can compare these views side by side, see the assumptions behind each forecast, and decide which story lines up more closely with how you see the stock.
Fair value in this bullish Narrative: US$320.19 per share.
Implied discount to this fair value at the last close of US$229.01: about 28.5% below the Narrative estimate.
Revenue growth used in this Narrative: 16.65% a year.
- Frames Honeywell International as an automation and energy technology company with about US$19.4b of contracted RemainCo backlog, tying that to data center demand, LNG projects and sustainable aviation fuel technologies.
- Argues that the current P/E multiple reflects a conglomerate structure and that separating aerospace could help the remaining automation focused business trade more in line with pure play peers.
- Highlights Honeywell Forge, higher margin software and services, and long dated energy technology contracts as important parts of the recurring cash flow story, while still acknowledging execution and macro risks.
Fair value in this bearish Narrative: US$199.69 per share.
Implied premium to this fair value at the last close of US$229.01: about 12.8% above the Narrative estimate.
Revenue growth used in this Narrative: 4.91% a year.
- Focuses on tariff exposure, softer end market sentiment and portfolio reshaping costs, including an estimated US$1.5b to US$2b of separation expenses, as potential headwinds for Honeywell International.
- Points to questions about how cohesive the post spin automation portfolio will be and whether the business can consistently deliver against its margin and growth targets.
- Uses a lower P/E multiple on future earnings to reach a fair value of about US$199.69 per share, and encourages investors to stress test these analyst style assumptions against their own expectations.
Taken together, these Narratives show how the same Honeywell International data can support very different conclusions once you pin down your assumptions on growth, margins and risk. If you want to see how other investors are joining those dots, or build a version that matches your own view, you can start by reading the full bullish and bearish Narratives in the Honeywell International Community section, then decide which story, if any, fits your investment approach.
Do you think there's more to the story for Honeywell International? Head over to our Community to see what others are saying!

This article by Simply Wall St is general in nature. We provide commentary based on historical data and analyst forecasts only using an unbiased methodology and our articles are not intended to be financial advice. It does not constitute a recommendation to buy or sell any stock, and does not take account of your objectives, or your financial situation. We aim to bring you long-term focused analysis driven by fundamental data. Note that our analysis may not factor in the latest price-sensitive company announcements or qualitative material. Simply Wall St has no position in any stocks mentioned.