How Does Knight-Swift’s Recent Stock Slide Affect Its True Value in 2025?
Knight-Swift Transportation Holdings Inc. Class A KNX | 57.58 | +3.82% |
If you have been keeping an eye on Knight-Swift Transportation Holdings, you are probably weighing whether now is the right time to take action on the stock. With a recent close at $41.41, Knight-Swift’s stock has been anything but predictable lately. Over the last week, shares have climbed 4.4%, hinting at a renewed sense of optimism in the market. However, zoom out a bit, and you will see a more complicated story: down 5.0% over the past month, off 21.5% year-to-date, and trailing by 15.7% over the last twelve months. Even the company’s three-year performance, at -11.1%, tells us that this isn’t just about short-term shocks. For anyone looking to make sense of all these numbers, it can feel a bit like trying to read the road ahead in a dense fog.
What is behind these moves? Much of it tracks broader industry and market shifts, as transportation stocks have responded to changing demand patterns and shifting perceptions of risk. Knight-Swift hasn’t been alone in feeling the bumps and dips, but its longer-term gains, including an 8.5% increase over five years, suggest that the full story is more nuanced than the latest headlines might have you believe.
So if you are wondering how the market is currently valuing Knight-Swift, here is a quick checkpoint: by our latest analysis, the company earns a valuation score of 3 out of 6, signaling it stands out as undervalued in three key respects. Of course, valuation is about much more than tabulating a single score. Let’s break down these valuation approaches, and stay tuned as we will wrap up with an even deeper perspective on how to truly measure this company’s worth.
Approach 1: Knight-Swift Transportation Holdings Discounted Cash Flow (DCF) Analysis
The Discounted Cash Flow (DCF) model is designed to estimate the intrinsic value of a company by projecting its future cash flows and discounting them back to today's dollars. This approach offers investors a long-term perspective and focuses on what the business can generate in free cash flow rather than current earnings or dividends.
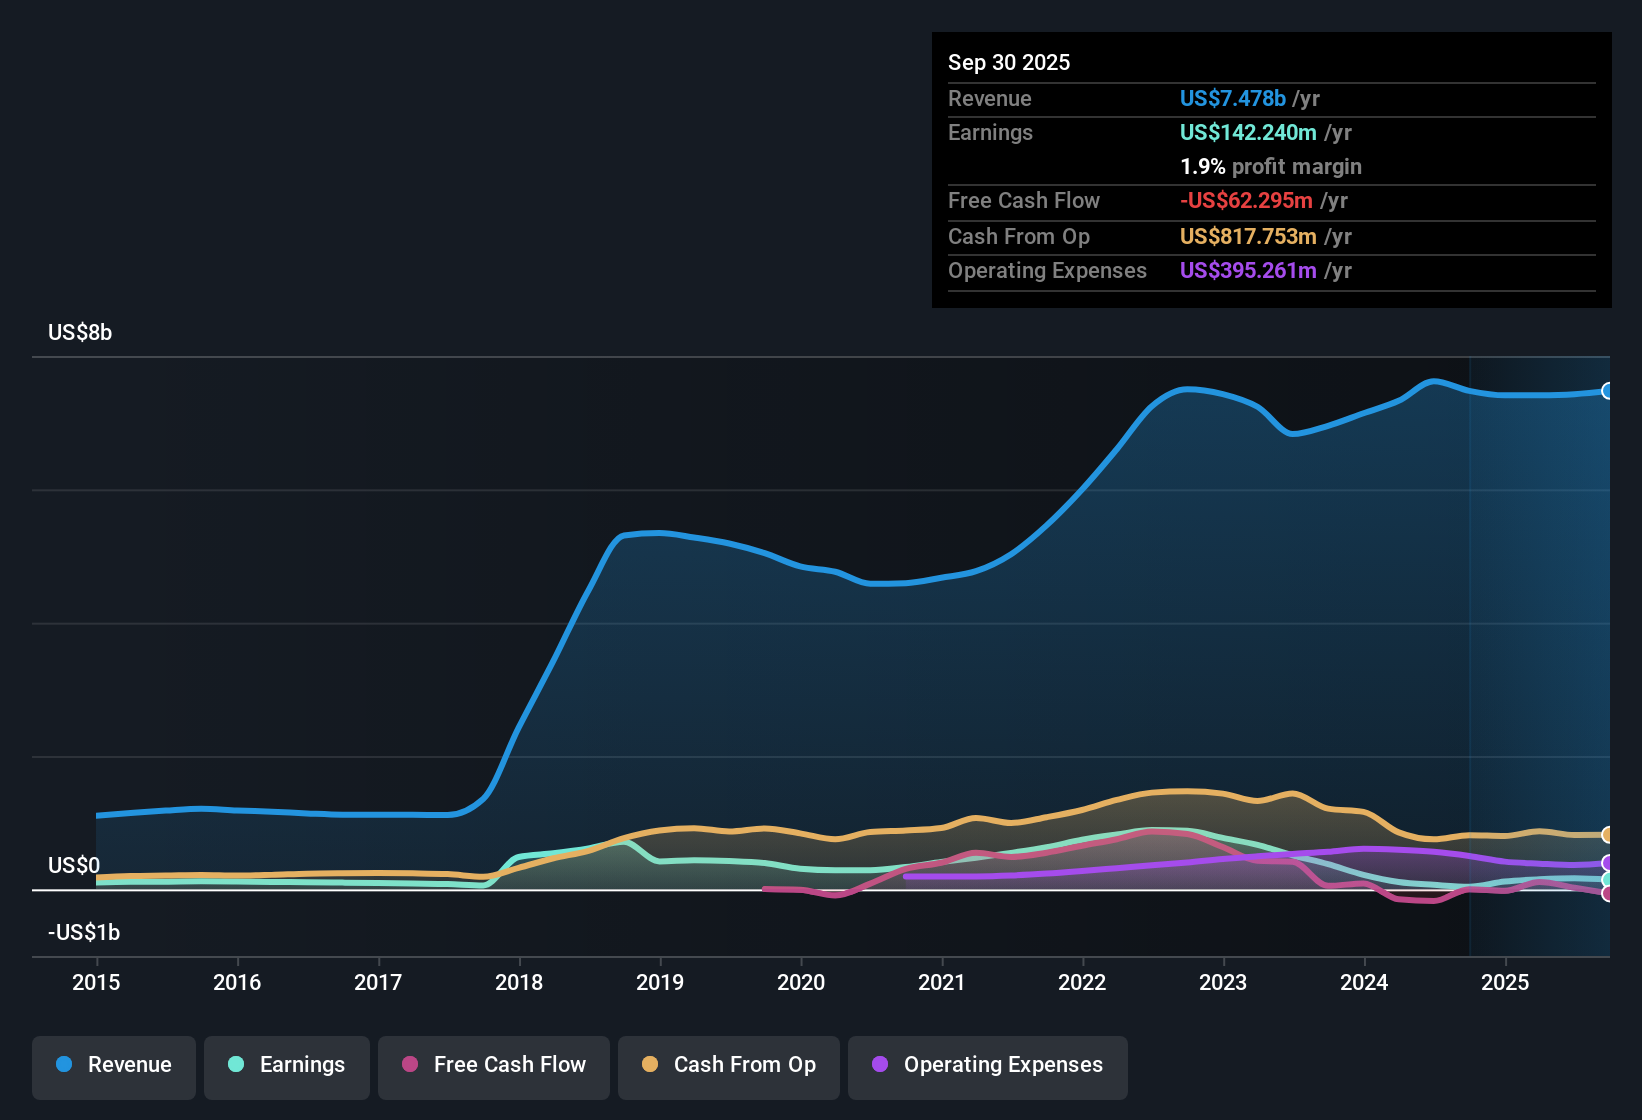
For Knight-Swift Transportation Holdings, recent data indicates that last twelve months' free cash flow stands at negative $115.5 million. However, analysts forecast robust growth over the coming years, expecting free cash flow to reach about $498.9 million in 2026. Looking further ahead, long-range projections extrapolated by Simply Wall St estimate that by 2035, Knight-Swift could be generating $3.49 billion in annual free cash flow, all expressed in US dollars.
Based on these projections, the DCF model arrives at an estimated intrinsic value of $225.92 per share. With the current share price around $41.41, the model suggests the stock is trading at an 81.7% discount to its underlying value. This substantial gap points to significant undervaluation by the market.
Result: UNDERVALUED
Our Discounted Cash Flow (DCF) analysis suggests Knight-Swift Transportation Holdings is undervalued by 81.7%. Track this in your watchlist or portfolio, or discover more undervalued stocks.
Approach 2: Knight-Swift Transportation Holdings Price vs Earnings
The Price-to-Earnings (PE) ratio is often the go-to metric for valuing profitable companies, because it reflects how much investors are willing to pay today for each dollar of current earnings. For businesses with relatively steady profits, like Knight-Swift Transportation Holdings, the PE ratio can provide quick insight into how the market views the company’s long-term earning power and potential risks.
However, what counts as a “normal” or “fair” PE ratio depends on several factors, such as growth expectations and risk. Generally, companies expected to grow faster or with lower risk command higher PE ratios. The market tends to discount those with lower growth prospects or higher uncertainty.
Currently, Knight-Swift trades at a PE ratio of 40.8x. This stands above the Transportation industry average of 24.1x and the peer average of 27.2x, signaling that the market currently prices Knight-Swift’s earnings at a steep premium compared to its sector. To provide a more tailored benchmark, Simply Wall St calculates a “Fair Ratio” for each stock by incorporating data such as earnings growth, industry trends, profit margins, market cap, and unique risk factors. For Knight-Swift, the Fair PE Ratio is 20.8x.
This Fair Ratio goes beyond simple industry or peer comparisons by taking into account the company’s individual growth outlook and risks alongside those market-wide metrics. As a result, it acts as a more nuanced way to assess whether the stock’s valuation is justified.
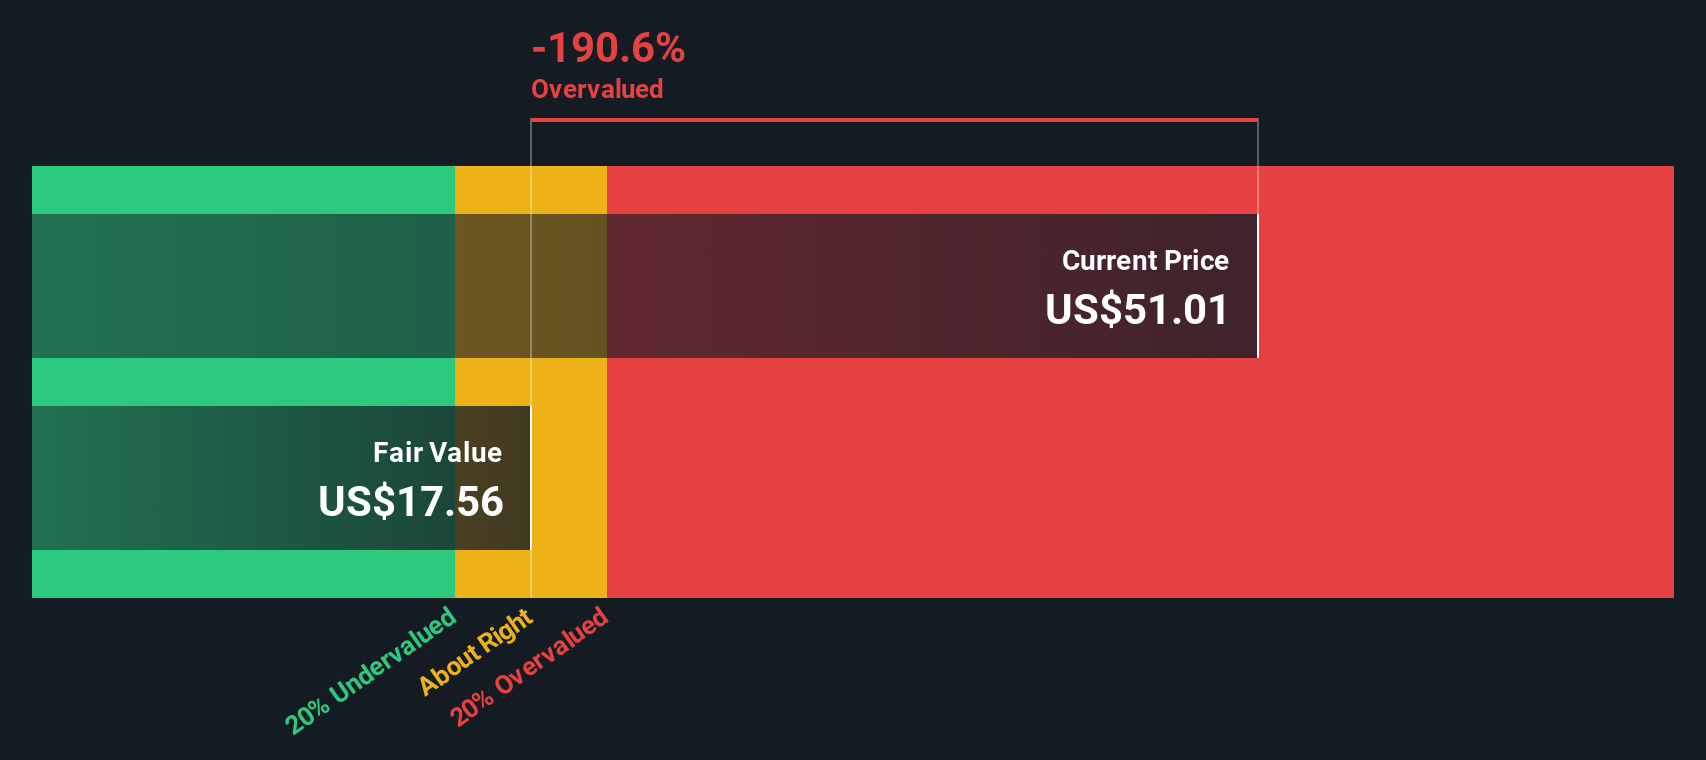
In this case, Knight-Swift’s actual PE ratio (40.8x) is noticeably higher than its Fair Ratio (20.8x), indicating the shares are currently overvalued relative to what would be expected given its fundamentals.
Result: OVERVALUED

PE ratios tell one story, but what if the real opportunity lies elsewhere? Discover companies where insiders are betting big on explosive growth.
Upgrade Your Decision Making: Choose your Knight-Swift Transportation Holdings Narrative
Earlier we mentioned that there is an even better way to understand valuation, so let us introduce you to Narratives. This approach empowers you to connect the story behind Knight-Swift Transportation Holdings with your own expectations for its future results and, ultimately, its fair value.
A Narrative is your personal perspective: it’s how you frame what is happening in the business, how you believe its revenue, margins, and growth will play out, and what you think the company is truly worth based on these forecasts. Narratives go beyond numbers alone by linking a company’s business story to concrete financial projections, and then translating those into a fair value tailored to your outlook.
This approach is completely accessible. Millions of investors use Narratives every day on Simply Wall St’s Community page to test their buy or sell decisions by comparing their own fair value to the current share price. Plus, Narratives are dynamic; as fresh news or company results come in, your Narrative updates to reflect those changes, making your investment framework adapt as new facts emerge.
For example, one investor following Knight-Swift might see the company’s expansion into LTL operations and new technology as catalysts for superior long-term earnings, supporting a bullish fair value target of $68.00 per share. Another may be more cautious about operational risks and forecast just $43.00, powerfully illustrating how Narratives help you invest on your own terms.
Do you think there's more to the story for Knight-Swift Transportation Holdings? Create your own Narrative to let the Community know!
This article by Simply Wall St is general in nature. We provide commentary based on historical data and analyst forecasts only using an unbiased methodology and our articles are not intended to be financial advice. It does not constitute a recommendation to buy or sell any stock, and does not take account of your objectives, or your financial situation. We aim to bring you long-term focused analysis driven by fundamental data. Note that our analysis may not factor in the latest price-sensitive company announcements or qualitative material. Simply Wall St has no position in any stocks mentioned.