How EOG’s Removal from the Russell 1000 Dynamic Index Will Impact EOG Resources (EOG) Investors
EOG Resources, Inc. EOG | 0.00 |
- EOG Resources, Inc. was recently removed from the Russell 1000 Dynamic Index, a change that can affect how index-tracking funds and rules-based investors gain exposure to the stock.
- This index exclusion may influence trading volumes and ownership mix for EOG, adding a new dimension to how investors assess its business outlook and capital allocation plans.
- We’ll now explore how EOG’s removal from the Russell 1000 Dynamic Index could reshape its investment narrative and investor positioning.
AI is about to change healthcare. These 40 stocks are working on everything from early diagnostics to drug discovery. The best part - they are all under $10b in market cap - there's still time to get in early.
EOG Resources Investment Narrative Recap
To own EOG Resources, you have to be comfortable with a company tied closely to oil and gas prices, yet focused on disciplined capital returns and a large resource base. EOG’s removal from the Russell 1000 Dynamic Index may affect trading flows and some short term sentiment, but it does not appear to change the core fundamental catalyst around execution on its portfolio or the key risks from energy transition and commodity price volatility.
The most relevant recent development alongside the index change is EOG’s US$10,000 million expansion of its share repurchase authorization, taking total buyback capacity to US$20,000 million. That decision, coupled with ongoing dividends, puts capital returns at the center of the near term story, while also highlighting a potential tension with longer term risks around sustaining capital needs, ESG driven capital access, and the durability of EOG’s drilling inventory.
Yet investors should not overlook the risk that prolonged commodity price weakness and higher capital intensity could pressure those generous buybacks and dividends...
EOG Resources' narrative projects $24.5 billion revenue and $7.3 billion earnings by 2029. This requires 1.2% yearly revenue growth and about a $1.8 billion earnings increase from $5.5 billion today.
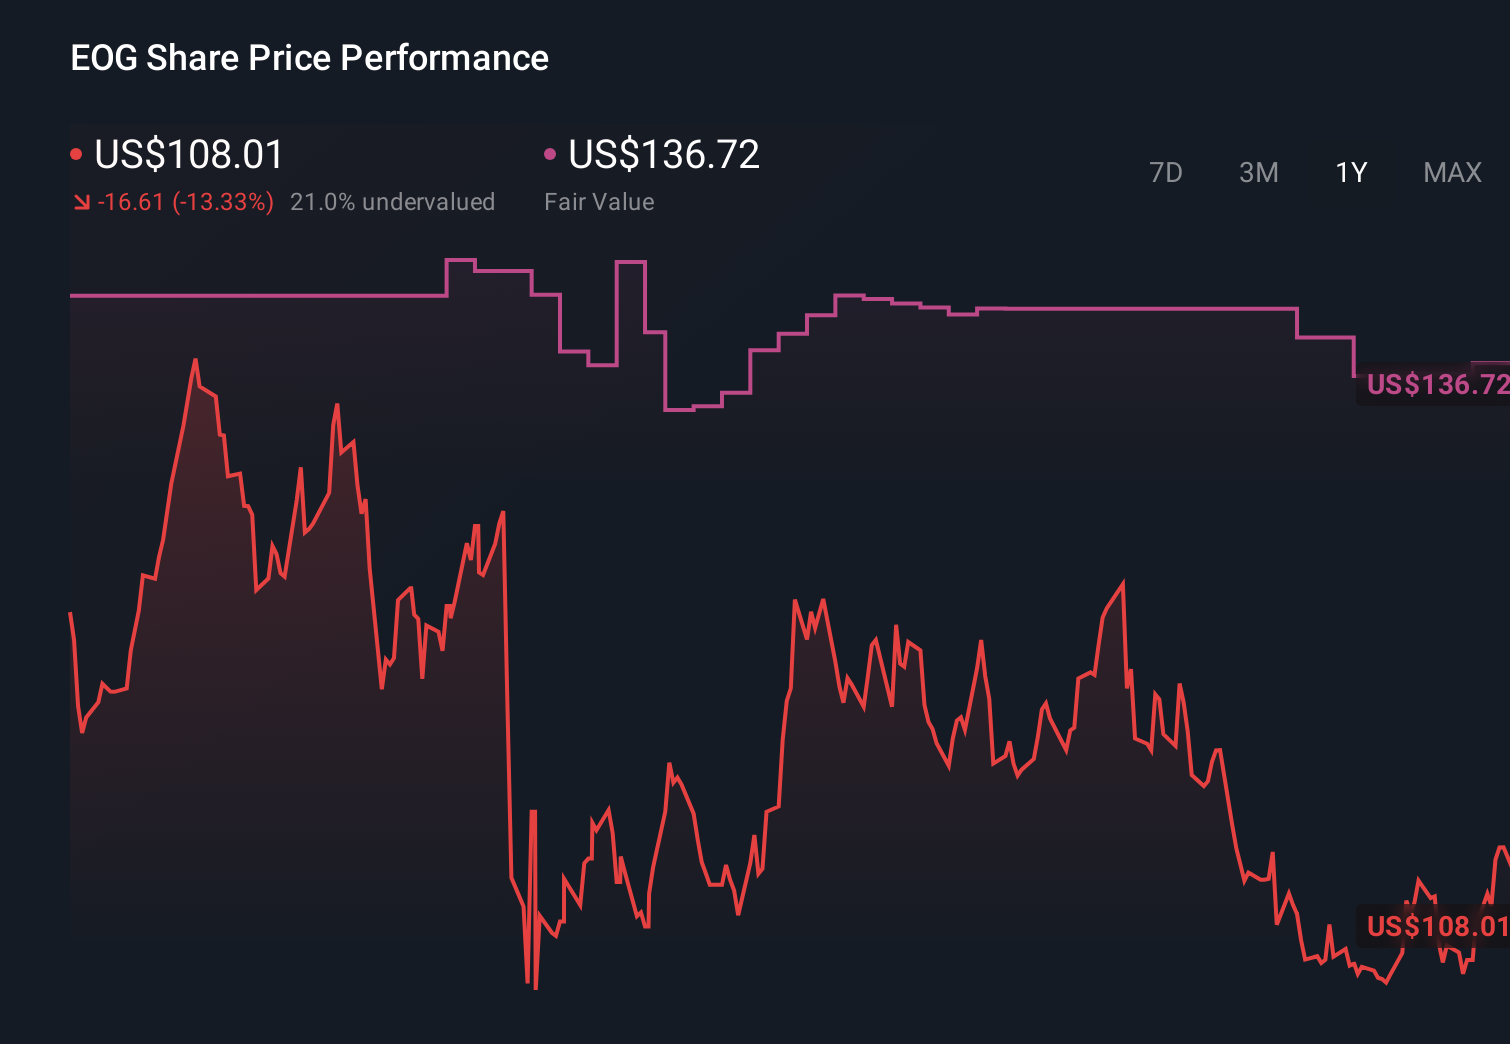
Uncover how EOG Resources' forecasts yield a $159.82 fair value, a 21% upside to its current price.
Exploring Other Perspectives
Before the index change, the most optimistic analysts were assuming revenue could reach about US$30.1 billion and earnings US$7.7 billion by 2029, which is far more upbeat than more cautious views tied to execution risk in newer plays and cost pressures. This split shows how differently you can interpret the same business, and the latest index removal may prompt you to revisit which version of EOG’s future you find most convincing.
Explore 8 other fair value estimates on EOG Resources - why the stock might be worth 24% less than the current price!
Form Your Own Verdict
Disagree with existing narratives? Extraordinary investment returns rarely come from following the herd, so go with your instincts.
- A great starting point for your EOG Resources research is our analysis highlighting 3 key rewards and 1 important warning sign that could impact your investment decision.
- Our free EOG Resources research report provides a comprehensive fundamental analysis summarized in a single visual - the Snowflake - making it easy to evaluate EOG Resources' overall financial health at a glance.
No Opportunity In EOG Resources?
Right now could be the best entry point. These picks are fresh from our daily scans. Don't delay:
- Invest in the nuclear renaissance through our list of 89 elite nuclear energy infrastructure plays powering the global AI revolution.
- The future of work is here. Discover the 29 top robotics and automation stocks leading the charge in AI-driven automation and industrial transformation.
- Capitalize on the AI infrastructure supercycle with our selection of the 51 best 'picks and shovels' of the AI gold rush converting record-breaking demand into massive cash flow.
This article by Simply Wall St is general in nature. We provide commentary based on historical data and analyst forecasts only using an unbiased methodology and our articles are not intended to be financial advice. It does not constitute a recommendation to buy or sell any stock, and does not take account of your objectives, or your financial situation. We aim to bring you long-term focused analysis driven by fundamental data. Note that our analysis may not factor in the latest price-sensitive company announcements or qualitative material. Simply Wall St has no position in any stocks mentioned.