How Manchester United (MANU) Valuation Stacks Up As Aggressive Transfer Plans Draw Investor Focus
Manchester United Plc Class A MANU | 0.00 |
Transfer activity puts Manchester United (MANU) in focus for investors
Recent reports that Manchester United (MANU) is actively pursuing high profile signings, including Aurelien Tchouameni and Moises Kean, have turned attention to how an aggressive transfer approach could affect the listed club’s finances.
The latest transfer speculation comes as Manchester United’s share price sits at $19.13, with a 1 month share price return of 9.5% and a year to date share price return of 21.23%. The 1 year total shareholder return is 33.5%, indicating momentum has been building over recent months.
If transfer talk has you rethinking where growth might come from next, it can be useful to compare with other sectors and check out 18 top founder-led companies
With MANU trading at $19.13, some investors may see the 33.5% 1 year total return and 25.9% intrinsic discount as sending mixed signals. This raises the question of whether there is still an opportunity to buy, or if the market is already pricing in future growth.
Price-to-Sales of 3.7x: Is it justified?
On current numbers, Manchester United trades on a P/S of 3.7x, which sits well above both its estimated fair P/S and the wider Entertainment industry.
The P/S ratio compares the company’s market value with its annual revenue and is often used when earnings are weak or volatile, as is the case for Manchester United which is still loss making. A higher multiple usually suggests investors are willing to pay more for each dollar of revenue, often because they expect stronger future profitability or more resilient revenue than peers.
Here, Manchester United’s P/S of 3.7x is described as expensive compared to its estimated fair P/S of 2.4x. This is a level our models suggest the market could move towards over time. It is also labelled expensive relative to both the peer average of 2.4x and the broader US Entertainment industry average of 1.5x, implying investors are currently paying a premium versus comparable companies.
Result: Price-to-Sales of 3.7x (OVERVALUED)
However, investors also need to weigh risks, including ongoing losses of £9.064m and the potential for costly transfers to strain cash flow if results disappoint.
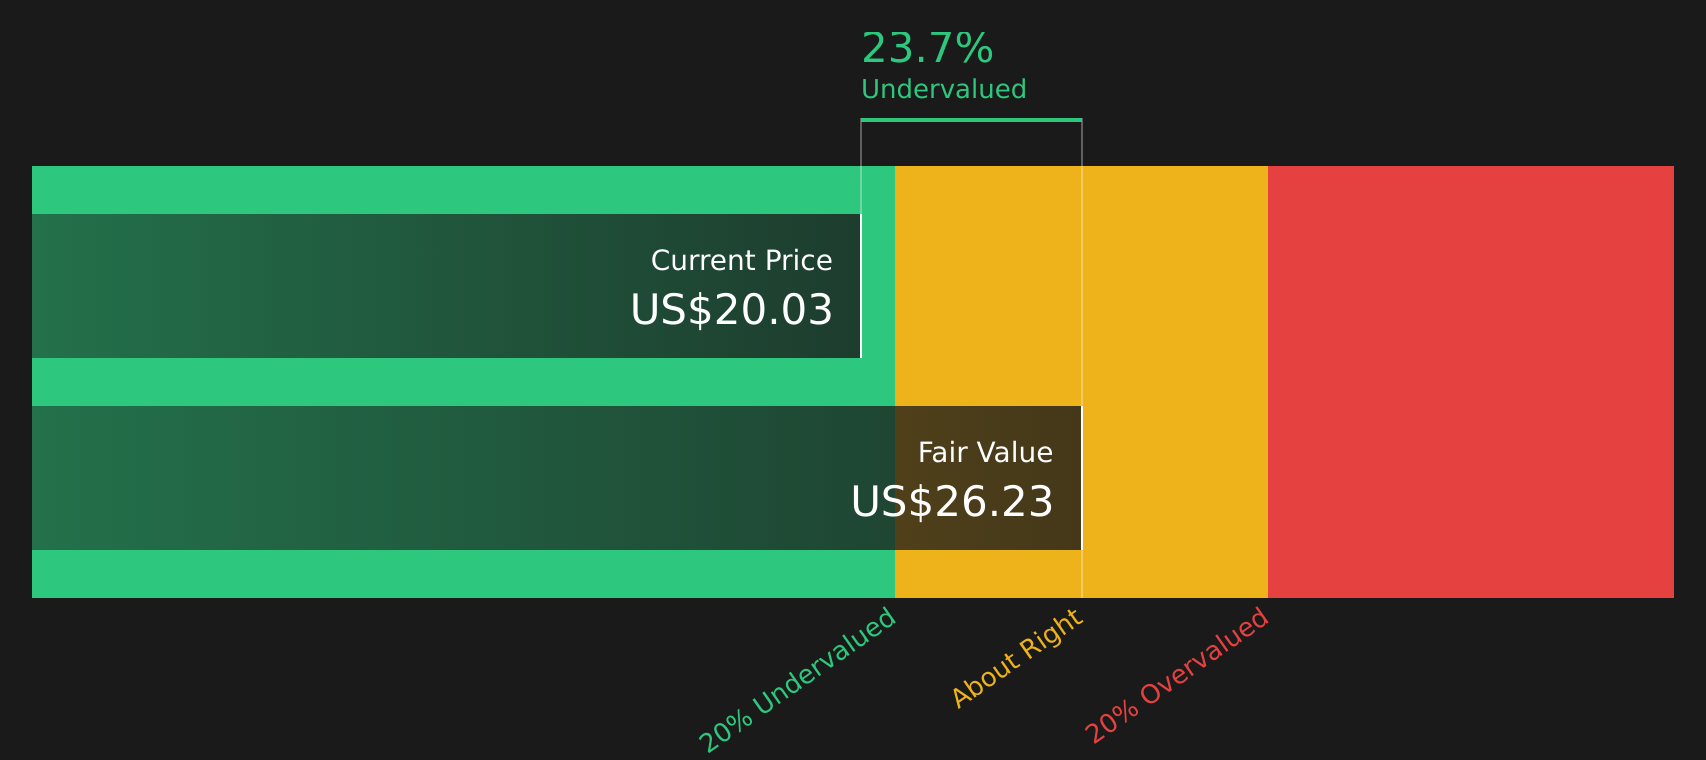
DCF points to undervaluation
While the P/S ratio suggests that Manchester United is expensive, our DCF model points in the opposite direction. With the stock at $19.13 versus an estimate of future cash flow value at $25.80, it appears undervalued. This raises a simple question: which signal do you place more weight on?
Simply Wall St performs a discounted cash flow (DCF) on every stock in the world every day (check out Manchester United for example). We show the entire calculation in full. You can track the result in your watchlist or portfolio and be alerted when this changes, or use our stock screener to discover 51 high quality undervalued stocks. If you save a screener we even alert you when new companies match - so you never miss a potential opportunity.
Next Steps
Mixed signals on valuation and transfer risk can make sentiment hard to read, so act while the data is fresh and weigh both sides using 3 key rewards and 1 important warning sign
Looking for more investment ideas?
If you are weighing what to do next after assessing Manchester United, it is worth scanning other opportunities that match different goals before the market moves on.
- Target potential mispricing by scanning companies trading below estimates of fair value with the 51 high quality undervalued stocks
- Strengthen your income stream by focusing on companies offering higher yields using the 12 dividend fortresses
- Sleep easier at night by filtering for companies with sturdier balance sheets through the solid balance sheet and fundamentals stocks screener (44 results)
This article by Simply Wall St is general in nature. We provide commentary based on historical data and analyst forecasts only using an unbiased methodology and our articles are not intended to be financial advice. It does not constitute a recommendation to buy or sell any stock, and does not take account of your objectives, or your financial situation. We aim to bring you long-term focused analysis driven by fundamental data. Note that our analysis may not factor in the latest price-sensitive company announcements or qualitative material. Simply Wall St has no position in any stocks mentioned.