Hubbell (HUBB) Is Down 5.4% After Russell 1000 Dynamic Index Exit – What’s Changed?
Hubbell Incorporated HUBB | 0.00 |
- In late June 2026, Hubbell Incorporated was removed from the Russell 1000 Dynamic Index, altering its presence in a widely followed benchmark.
- This index removal can matter for investors because it may prompt forced buying and selling by index-tracking funds, affecting Hubbell’s shareholder base.
- Now, we’ll examine how Hubbell’s removal from the Russell 1000 Dynamic Index may influence its existing investment narrative and long-term positioning.
The future of work is here. Discover the 29 top robotics and automation stocks leading the charge in AI-driven automation and industrial transformation.
Hubbell Investment Narrative Recap
To own Hubbell, you generally need to believe in steady demand for grid modernization and electrical infrastructure, supported by disciplined pricing and productivity actions. The drop from the Russell 1000 Dynamic Index may create some near term trading noise, but it does not fundamentally change the key catalyst around utility and data center driven growth, nor the major risks around tariffs, cost inflation, and potential recessionary pressure on volumes.
The most relevant recent development alongside the index removal is Hubbell’s raised 2026 guidance in April, with expected sales growth of 8% to 11% and higher GAAP EPS guidance. This update underscores management’s focus on pricing and productivity to offset cost pressures, which ties directly into the current catalyst of margin stability and the ongoing risk that materials, tariffs, or weaker demand could erode profitability if pricing actions fall short.
But while the guidance looks constructive, investors still need to be aware of how tariff and cost inflation risk could...
Hubbell's narrative projects $7.3 billion revenue and $1.2 billion earnings by 2029.
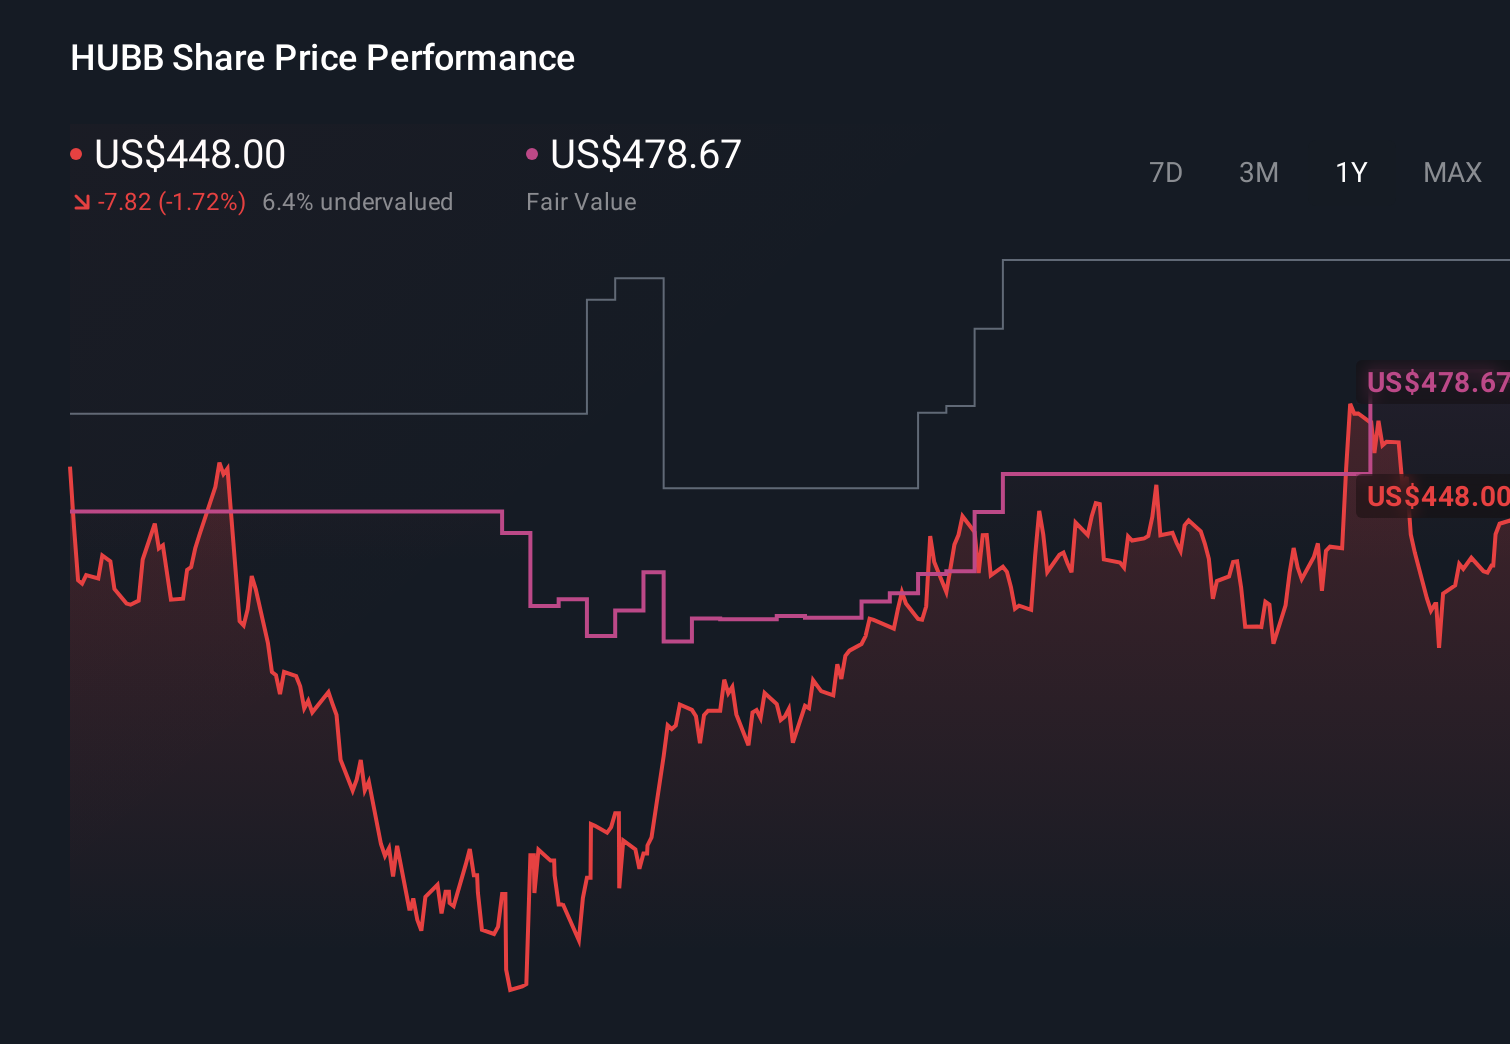
Uncover how Hubbell's forecasts yield a $550.77 fair value, a 12% upside to its current price.
Exploring Other Perspectives
Some of the most optimistic analysts were expecting revenue to reach about US$8.4 billion and earnings of US$1.2 billion, yet the recent index removal and ongoing telecom and utility headwinds highlight how differently you and those analysts might weigh risks to that outlook, and why it is worth comparing several viewpoints before deciding what you believe about Hubbell’s future.
Explore 3 other fair value estimates on Hubbell - why the stock might be worth as much as 14% more than the current price!
The Verdict Is Yours
Disagree with existing narratives? Extraordinary investment returns rarely come from following the herd, so go with your instincts.
- A great starting point for your Hubbell research is our analysis highlighting 3 key rewards and 1 important warning sign that could impact your investment decision.
- Our free Hubbell research report provides a comprehensive fundamental analysis summarized in a single visual - the Snowflake - making it easy to evaluate Hubbell's overall financial health at a glance.
Contemplating Other Strategies?
Our daily scans reveal stocks with breakout potential. Don't miss this chance:
- Capitalize on the AI infrastructure supercycle with our selection of the 53 best 'picks and shovels' of the AI gold rush converting record-breaking demand into massive cash flow.
- Rare earth metals are the new gold rush. Find out which 31 stocks are leading the charge.
- Explore 26 top quantum computing companies leading the revolution in next-gen technology and shaping the future with breakthroughs in quantum algorithms, superconducting qubits, and cutting-edge research.
This article by Simply Wall St is general in nature. We provide commentary based on historical data and analyst forecasts only using an unbiased methodology and our articles are not intended to be financial advice. It does not constitute a recommendation to buy or sell any stock, and does not take account of your objectives, or your financial situation. We aim to bring you long-term focused analysis driven by fundamental data. Note that our analysis may not factor in the latest price-sensitive company announcements or qualitative material. Simply Wall St has no position in any stocks mentioned.