

Interactive Brokers Group (IBKR) Faces A Valuation Test Following Strong Earnings And Crypto Expansion
Interactive Brokers Group, Inc. Class A IBKR | 0.00 |
Interactive Brokers Group (IBKR) is back in focus after reporting second quarter 2026 net income of US$312 million and affirming its quarterly dividend, as well as expanding its crypto trading and stablecoin funding features.
These updates arrive after a strong run in Interactive Brokers Group's stock, with a 90 day share price return of 19.07% and a year to date share price return of 37.25%. The 5 year total shareholder return is very large, pointing to momentum that long term holders have already experienced.
If the crypto expansion at Interactive Brokers Group has caught your attention, this can be a useful moment to look across the market and see what else is gaining traction through the 19 cryptocurrency and blockchain stocks
The stock has already moved sharply on Interactive Brokers Group's crypto push and recent earnings. Is the current price still reasonable to pay, or does it make more sense to wait for a pullback before adding exposure?
Most Popular Narrative: 4.5% Overvalued
The most followed valuation view currently pegs Interactive Brokers Group’s fair value at about $88.27, compared with a last close of $92.27. That gap sets the context for a growth focused story built on product expansion, rising client balances and higher expected earnings.
The ongoing popularity of investing with global interest from investors who increasingly want broad portfolios and international access is expected to drive sustained account growth, attracting both individual and institutional investors and boosting overall revenue.
The introduction of new products and enhancements, such as the strengthened ATS with new liquidity providers and order types, enhancements to the IBKR Financial Advisor Portal, and the launch of securities lending for Swedish stocks, suggests potential for increased trading activity and higher commission revenue.
Want to see what is backing that fair value for Interactive Brokers Group? The narrative leans on brisk revenue expansion, slightly higher margins and a premium earnings multiple that still steps down from today. Curious which assumptions really carry the weight in that model and how sensitive the valuation is to them? The full breakdown sets out those moving parts in far more detail.
Result: Fair Value of $88.27 (OVERVALUED)
However, the Interactive Brokers Group narrative can shift quickly if trading volumes soften or if interest rate moves reduce the return on large client cash balances.
Another View On Interactive Brokers Group's Valuation
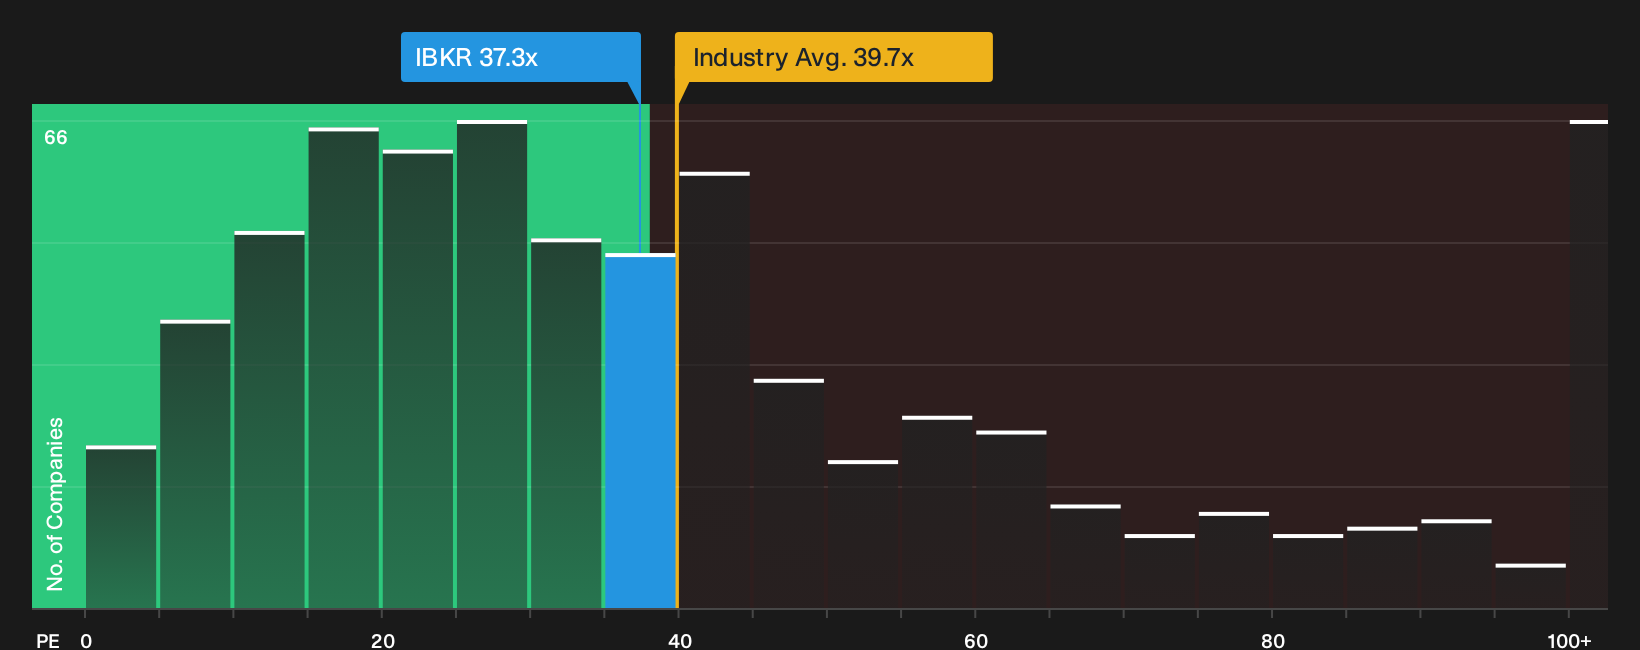
Analysts see Interactive Brokers Group as about 4.5% overvalued versus their $88.27 fair value, yet its current P/E of 36.5x tells a different story. That P/E sits below the US Capital Markets industry at 39.7x, above peers at 24.3x, and above a fair ratio of 22.9x. So is the market paying up for quality, or just for recent momentum?
To see how that P/E gap could close in either direction, and what it might mean for your own assumptions, take a closer look at the valuation breakdown in the See what the numbers say about this price — find out in our valuation breakdown.
Next Steps
With mixed signals around Interactive Brokers Group's valuation and growth story, this is a good moment to move fast and test the numbers yourself. To balance the concern around potential risks with the optimism around its rewards, start with the full rundown of the 3 key rewards and 1 important warning sign.
Looking for more investment ideas beyond Interactive Brokers Group?
If Interactive Brokers Group has sharpened your focus, do not stop here. Broaden your watchlist now so you are not looking back at missed opportunities later.
- Target resilient income potential by checking out 8 dividend fortresses that prioritize steady payouts alongside balance sheet strength.
- Spot potential value opportunities early and review the screener containing 20 high quality undiscovered gems before the market fully catches on.
- Prioritize capital preservation and scan the 84 resilient stocks with low risk scores that score well on financial health and risk metrics.
This article by Simply Wall St is general in nature. We provide commentary based on historical data and analyst forecasts only using an unbiased methodology and our articles are not intended to be financial advice. It does not constitute a recommendation to buy or sell any stock, and does not take account of your objectives, or your financial situation. We aim to bring you long-term focused analysis driven by fundamental data. Note that our analysis may not factor in the latest price-sensitive company announcements or qualitative material. Simply Wall St has no position in any stocks mentioned.