Interparfums And 2 Other Leading Dividend Stocks To Consider
Interparfums, Inc. IPAR | 0.00 |
The United States market has shown a robust performance, rising by 2.3% over the last week and 25% over the past year, with earnings anticipated to grow by 19% annually in the coming years. In such a thriving environment, selecting dividend stocks that offer reliable income and potential for capital appreciation can be an attractive strategy for investors seeking stability and growth.
Top 10 Dividend Stocks In The United States
| Name | Dividend Yield | Dividend Rating |
| Peoples Bancorp (PEBO) | 4.65% | ★★★★★☆ |
| OTC Markets Group (OTCM) | 5.74% | ★★★★★★ |
| Huntington Bancshares (HBAN) | 3.58% | ★★★★★☆ |
| First Interstate BancSystem (FIBK) | 5.15% | ★★★★★★ |
| Ennis (EBF) | 4.88% | ★★★★★★ |
| Donegal Group (DGIC.A) | 4.41% | ★★★★★★ |
| Columbia Banking System (COLB) | 4.79% | ★★★★★★ |
| CareTrust REIT (CTRE) | 4.21% | ★★★★★☆ |
| Banco Latinoamericano de Comercio Exterior S. A (BLX) | 4.64% | ★★★★★☆ |
| Accenture (ACN) | 3.94% | ★★★★★☆ |
Here we highlight a subset of our preferred stocks from the screener.
Interparfums (IPAR)
Simply Wall St Dividend Rating: ★★★★☆☆
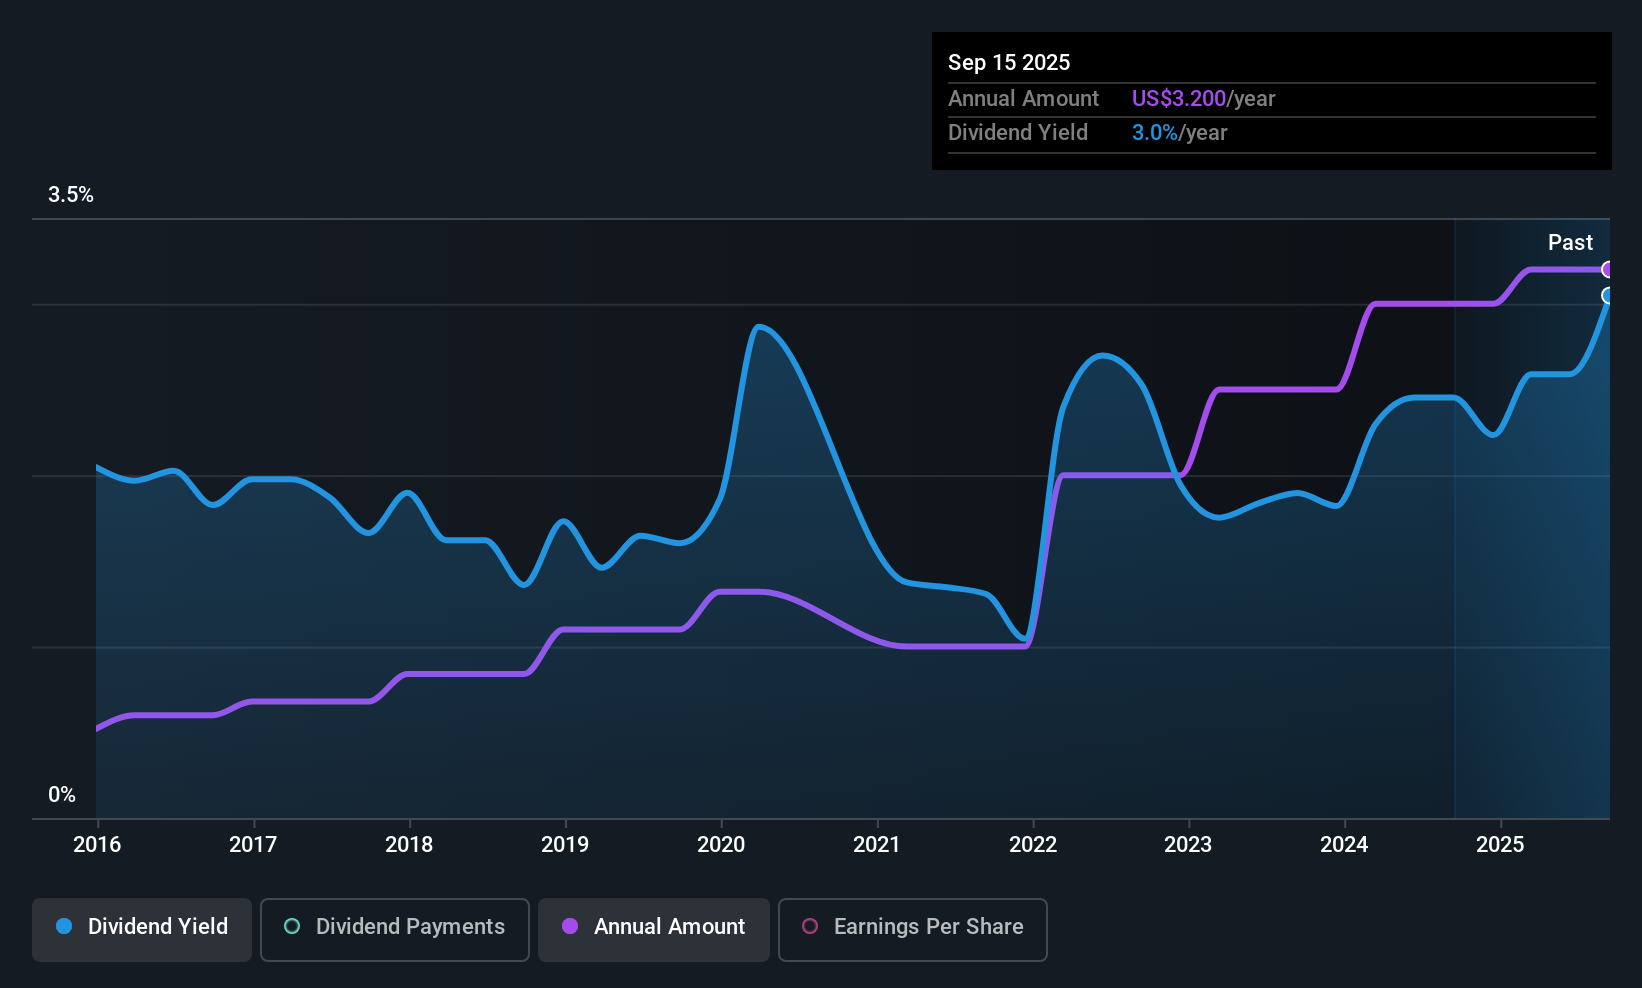
Overview: Interparfums, Inc. is engaged in the manufacturing, marketing, and distribution of a variety of fragrances and related products both in the United States and internationally, with a market cap of $3.21 billion.
Operations: Interparfums generates its revenue primarily from fragrances and fragrance-related products, amounting to $1.49 billion.
Dividend Yield: 3.2%
Interparfums, Inc. offers a quarterly dividend of US$0.80 per share, with dividends covered by earnings (payout ratio 60.6%) and cash flows (cash payout ratio 52.6%). Despite reasonable coverage, the dividend track record has been volatile over the past decade, lacking consistent growth or stability. Recent financials show modest earnings growth with Q1 2026 net income at US$43.37 million. The company reaffirmed its sales guidance for 2026 at US$1.48 billion amidst recent auditor changes due to internal control issues.
ConocoPhillips (COP)
Simply Wall St Dividend Rating: ★★★★☆☆
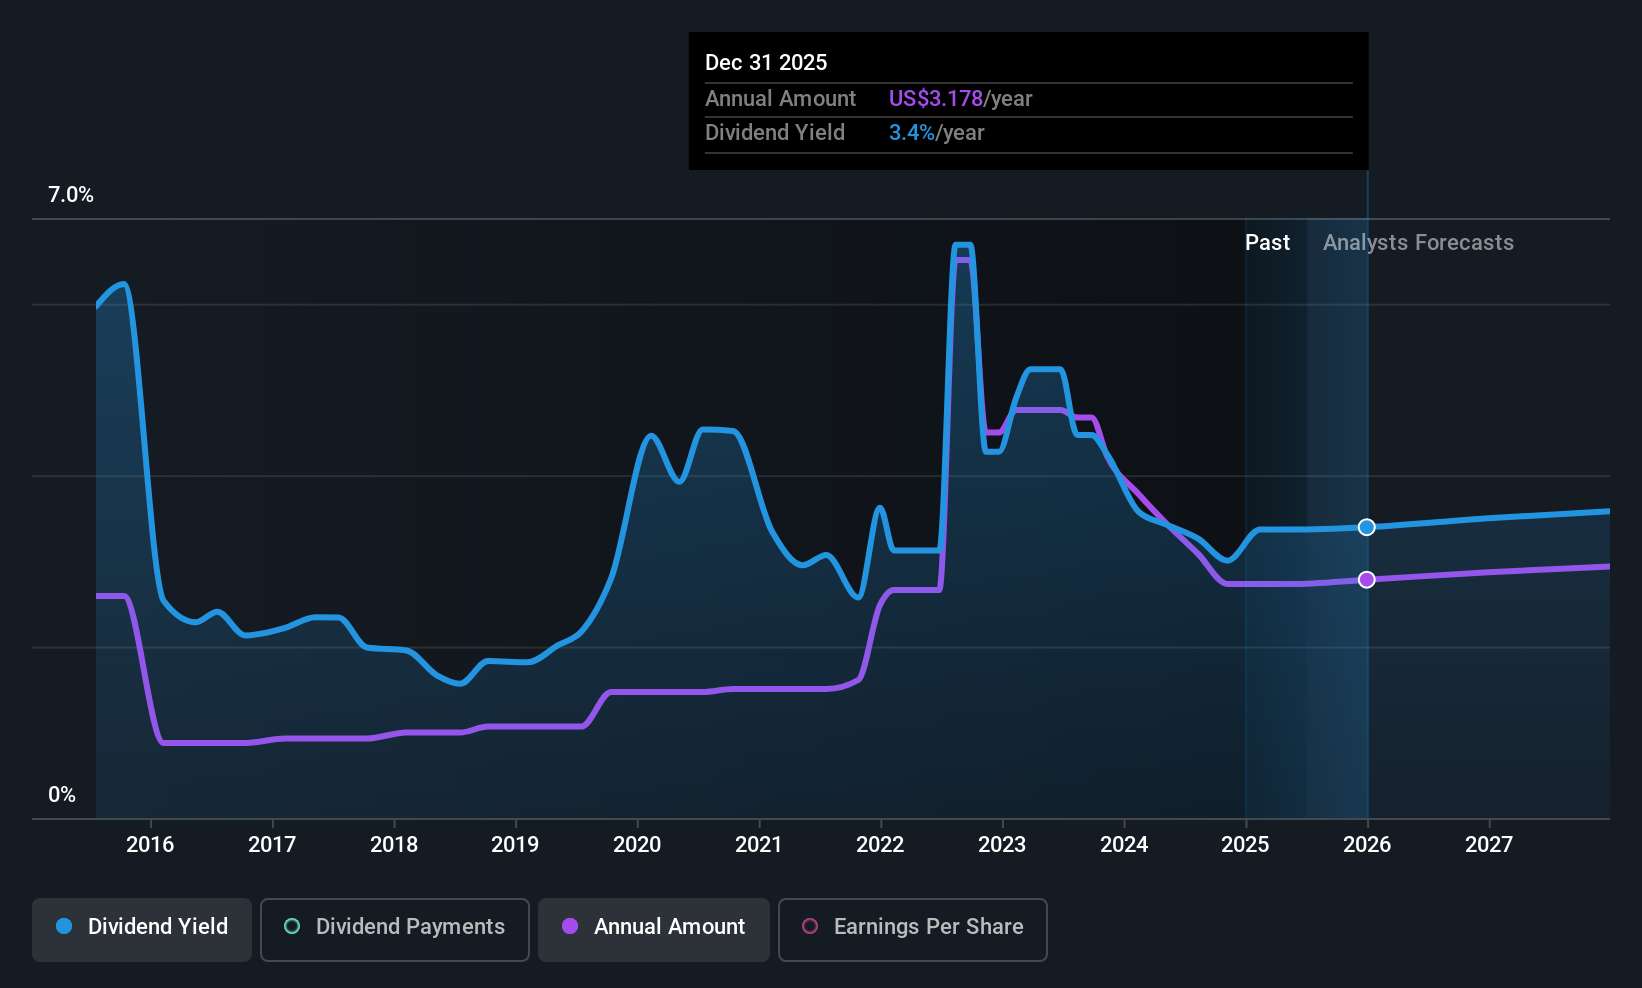
Overview: ConocoPhillips is involved in the exploration, production, transportation, and marketing of crude oil, bitumen, natural gas, LNG, and natural gas liquids with a market cap of $136.77 billion.
Operations: ConocoPhillips generates revenue from several geographic segments, including Alaska ($5.55 billion), Canada ($5.74 billion), Lower 48 ($40.95 billion), Asia Pacific ($2.57 billion), and Europe, Middle East and North Africa ($6.65 billion).
Dividend Yield: 3%
ConocoPhillips declared a US$0.84 per share dividend for Q2 2026, with dividends covered by earnings (payout ratio 55%) and cash flows (cash payout ratio 69.9%). Despite reasonable coverage, the dividend track record has been unstable over the past decade. Recent developments include a gas sales agreement with Glenfarne Alaska LNG LLC to enhance energy security in Alaska and participation in an exploration MoU offshore Syria, reflecting strategic growth initiatives amid fluctuating earnings performance.
Del Monte (FDP)
Simply Wall St Dividend Rating: ★★★★☆☆
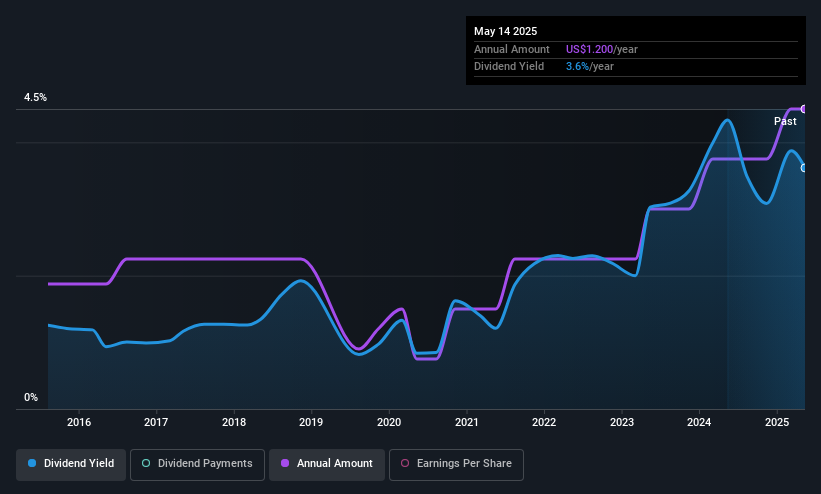
Overview: Del Monte Corporation, with a market cap of $1.37 billion, operates through its subsidiaries to produce, market, and distribute fresh and fresh-cut fruits and vegetables across North America, Europe, the Middle East, North Africa, Asia, and internationally.
Operations: Del Monte Corporation's revenue is primarily derived from its Fresh and Value-Added Products segment at $2.56 billion and the Banana segment at $1.48 billion, with additional contributions from Other Products and Services totaling $214.10 million.
Dividend Yield: 4.2%
Fresh Del Monte Produce's dividend payments are covered by earnings (payout ratio 82.3%) and cash flows (cash payout ratio 32.6%), though the track record has been volatile over the past decade. The company announced a quarterly dividend of US$0.30 per share, payable on June 11, 2026. Recent Q1 results showed a decline in net income to US$10 million from US$31.1 million year-over-year, indicating potential earnings challenges ahead for sustaining dividends consistently.
Next Steps
- Gain an insight into the universe of 99 Top US Dividend Stocks by clicking here.
- Already own these companies? Bring clarity to your investment decisions by linking up your portfolio with Simply Wall St, where you can monitor all the vital signs of your stocks effortlessly.
- Invest smarter with the free Simply Wall St app providing detailed insights into every stock market around the globe.
Ready For A Different Approach?
- Explore high-performing small cap companies that haven't yet garnered significant analyst attention.
- Fuel your portfolio with companies showing strong growth potential, backed by optimistic outlooks both from analysts and management.
- Find companies with promising cash flow potential yet trading below their fair value.
This article by Simply Wall St is general in nature. We provide commentary based on historical data and analyst forecasts only using an unbiased methodology and our articles are not intended to be financial advice. It does not constitute a recommendation to buy or sell any stock, and does not take account of your objectives, or your financial situation. We aim to bring you long-term focused analysis driven by fundamental data. Note that our analysis may not factor in the latest price-sensitive company announcements or qualitative material. Simply Wall St has no position in any stocks mentioned.