Intuitive Surgical (ISRG) Stock Could Be 23.6% Undervalued After Q1 da Vinci 5 Demand
Intuitive Surgical, Inc. ISRG | 0.00 |
Intuitive Surgical (ISRG) is back in focus after Q1 2026 data showed 431 da Vinci systems placed, a 17% year over year increase, with upgrades to the da Vinci 5 and higher leasing activity shaping hospital demand.
Despite the Q1 2026 da Vinci 5 upgrade cycle and stronger leasing uptake, Intuitive Surgical’s short term share price momentum has softened, with the share price down 27.62% year to date but a 5 year total shareholder return of 34.91% still positive.
If this kind of surgical robotics story interests you, it may be worth widening your watchlist with other robotics and automation opportunities using the Simply Wall St screener for 31 robotics and automation stocks
With Intuitive Surgical shares down 27.62% year to date and trading only about 2% below one estimate of intrinsic value, investors face a key question: is this a genuine opportunity, or is the market already pricing in future growth?
Most Popular Narrative: 23.6% Undervalued
Compared with the last close at $406.78, the most followed narrative puts Intuitive Surgical’s fair value at $532.46, implying a sizeable valuation gap and raising the question of what assumptions sit behind that number.
Over the next 5 years I calculate with (actual values from 18.01.26, price/shr at 533 USD): Revenue Growth p.a.: 12% (Currently at 14,7%), we saw the peak of revenue growth with nearly 15%. Now even 12% is sporty, but with the „abo like“ revenues from spare parts and software licences, based on a still growing bases of installed systems, realistic. Profit Margin: 30% (currently at 28,6%) because spare parts in general have more margin then system sales, and the sales out of spare parts is still growing. Future PE: 50 (currently at 69), the high PE’s are tipical for fast growers, but over time the PE will go down, I see for next 5 years 50, in 10 years it could come down to 40. Interest rate: 6,77% (same as current)
Want to see how an installed base story, recurring instrument revenue, firm margins and a rich future earnings multiple all combine to justify that fair value gap? The full narrative spells out the assumptions line by line and shows exactly how they roll up into the $532.46 estimate for Intuitive Surgical.
Result: Fair Value of $532.46 (UNDERVALUED)
However, this Intuitive Surgical narrative could be challenged if procedure volumes or instrument usage slow, or if new competing systems pressure pricing and installed base growth.
Another View: Intuitive Surgical Through Earnings Multiples
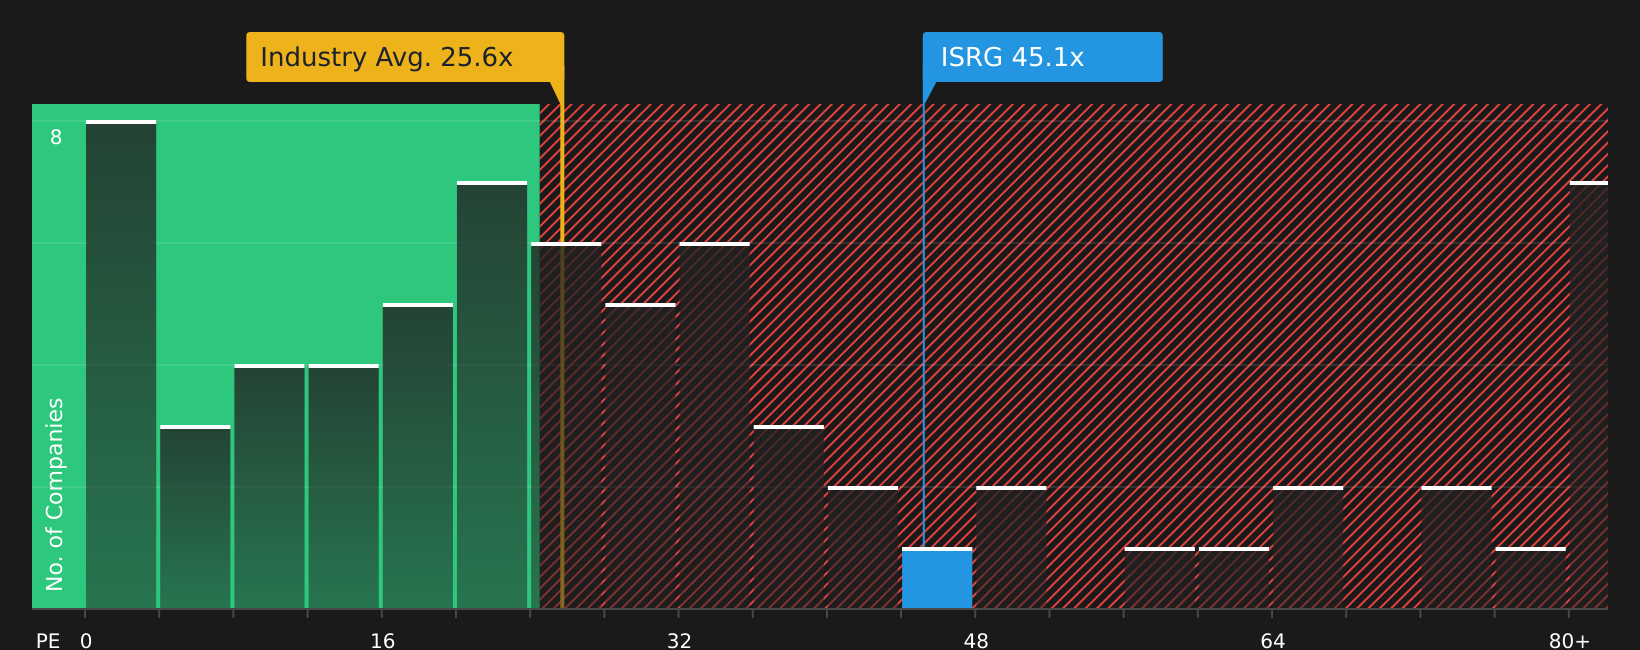
That 23.6% undervalued story sits beside a much tougher earnings multiple picture for Intuitive Surgical. The stock trades on a P/E of 48.4x, compared with 24.4x for the wider US Medical Equipment industry, 25x for peers, and a fair ratio estimate of 31.3x.
Put simply, the SWS fair ratio suggests the P/E could move closer to 31.3x over time. This would weaken the case that Intuitive Surgical is cheap and instead highlights valuation risk if expectations cool.
Next Steps
Does the mix of optimism and valuation risk around Intuitive Surgical leave you undecided? Take a closer look at the underlying positives by reviewing the 4 key rewards.
Looking for more investment ideas beyond Intuitive Surgical?
If Intuitive Surgical has sharpened your focus on quality opportunities, do not stop here. Broaden your watchlist today and give yourself more options tomorrow.
- Target potential upside in overlooked opportunities by scanning the screener containing 20 high quality undiscovered gems that pair strong fundamentals with lower market attention.
- Strengthen your core holdings by reviewing the solid balance sheet and fundamentals stocks screener (48 results) that highlight companies with sturdier financial footing.
- Dial back risk without stepping away from the market by using the 66 resilient stocks with low risk scores that focuses on more resilient stocks.
This article by Simply Wall St is general in nature. We provide commentary based on historical data and analyst forecasts only using an unbiased methodology and our articles are not intended to be financial advice. It does not constitute a recommendation to buy or sell any stock, and does not take account of your objectives, or your financial situation. We aim to bring you long-term focused analysis driven by fundamental data. Note that our analysis may not factor in the latest price-sensitive company announcements or qualitative material. Simply Wall St has no position in any stocks mentioned.