Is A. O. Smith (AOS) Now Offering Value After Recent Share Price Pullback
A. O. Smith Corporation AOS | 0.00 |
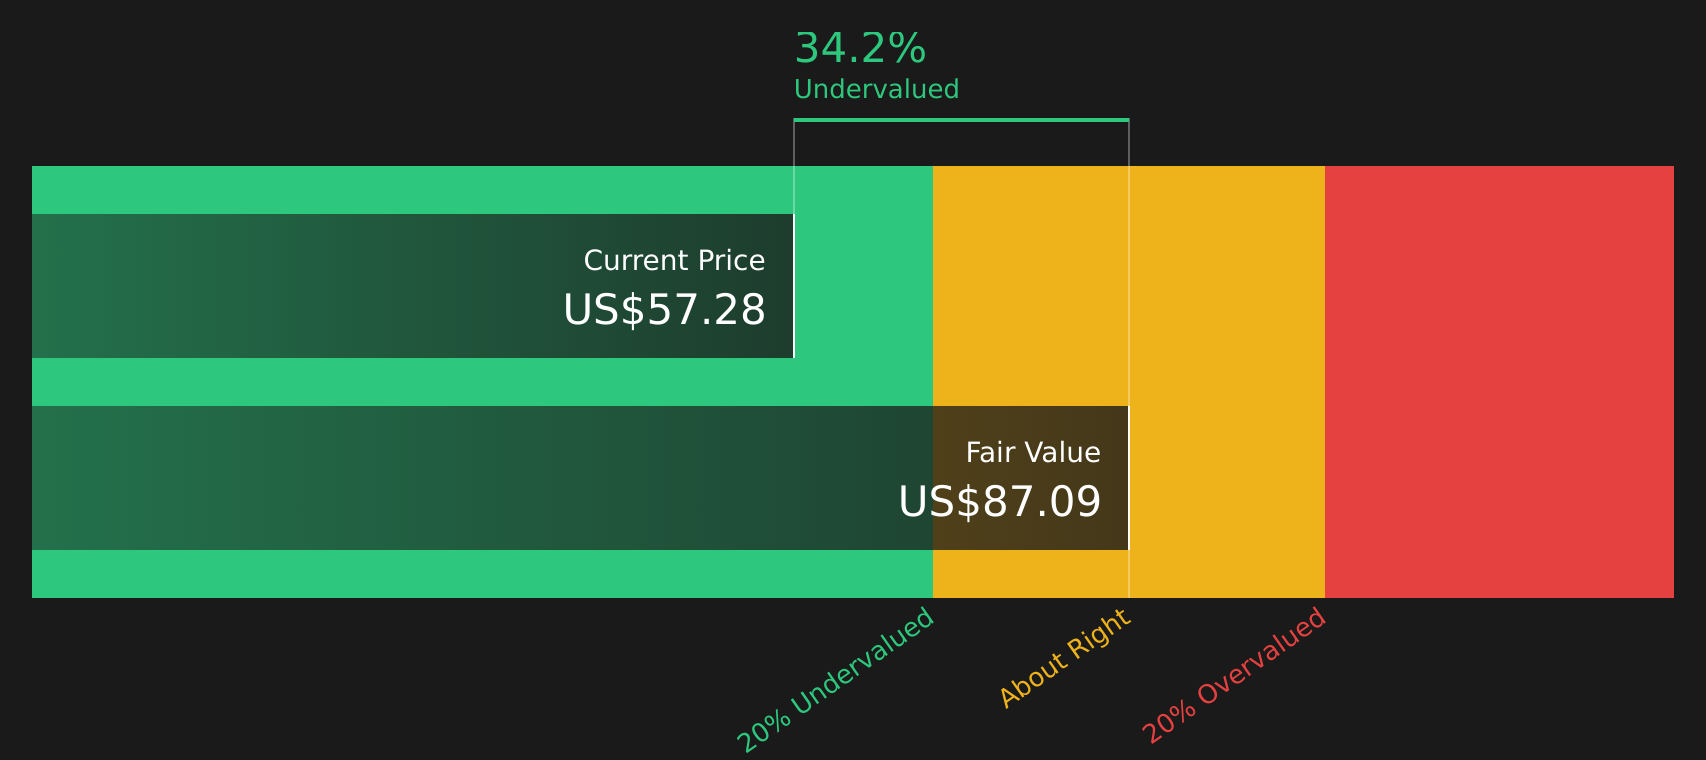
- Wondering whether A. O. Smith at around US$56.98 is starting to look like value, or if the recent weakness is a warning sign for your portfolio?
- The stock has pulled back recently, with the share price down 6.7% over the past week, 15.2% over the past month, 16.6% year to date, and 14.9% over the past year. This may signal shifting views on its growth potential or risk profile.
- These moves have come as investors reassess established industrial stocks and refocus on pricing, capital allocation and balance sheet quality across the sector. Even without a single headline event driving the share price, sentiment toward steady compounders like A. O. Smith can change quickly as broader market narratives rotate.
- A key starting point is its valuation score of 6/6, which reflects how the stock screens across six different undervaluation checks. This article will walk through the usual valuation approaches, then finish with a broader framework to help you judge whether that score really matches your own view of value.
Approach 1: A. O. Smith Discounted Cash Flow (DCF) Analysis
A Discounted Cash Flow, or DCF, model takes the cash that a company is expected to generate in the future and discounts those projections back to a single value today, using a required rate of return.
For A. O. Smith, the model used is a 2 Stage Free Cash Flow to Equity approach. The latest twelve month Free Cash Flow is about $624.1 million. Analyst estimates and extrapolations indicate projected Free Cash Flow of $795.4 million in 2035, with interim years such as 2026 and 2029 at $531.8 million and $629.6 million respectively. Simply Wall St only uses analyst forecasts where they are available and extends the series using its own assumptions for the later years.
When all those future cash flows are discounted back to today, the resulting intrinsic value estimate is $80.83 per share. Compared with the recent share price around $56.98, this model implies the stock trades at roughly a 29.5% discount, which suggests it is undervalued on this DCF view.
Result: UNDERVALUED
Our Discounted Cash Flow (DCF) analysis suggests A. O. Smith is undervalued by 29.5%. Track this in your watchlist or portfolio, or discover 47 more high quality undervalued stocks.
Approach 2: A. O. Smith Price vs Earnings
For a profitable company like A. O. Smith, the P/E ratio is a straightforward way to link what you pay for the stock to the earnings it currently generates. Investors usually accept a higher P/E when they expect stronger growth or see less risk, and a lower P/E when growth expectations or perceived risks are more modest.
A. O. Smith trades on a P/E of 14.9x, compared with the Building industry average of about 20.6x and a peer group average of 45.2x. On those simple comparisons, the stock sits below both the industry and peer benchmarks.
Simply Wall St also calculates a Fair Ratio of 21.0x for A. O. Smith. This is a proprietary estimate of what the P/E might be given factors such as earnings growth, profit margins, industry, market cap and risk profile. That makes it more tailored than a broad industry or peer comparison, which may mix companies with very different characteristics. Since the current P/E of 14.9x is meaningfully below the Fair Ratio of 21.0x, this multiple view points to the stock trading at a discount.
Result: UNDERVALUED

P/E ratios tell one story, but what if the real opportunity lies elsewhere? Start investing in legacies, not executives. Discover our 20 top founder-led companies.
Upgrade Your Decision Making: Choose your A. O. Smith Narrative
Earlier it was mentioned that there is an even better way to understand valuation. Narratives on Simply Wall St let you connect your view of A. O. Smith’s story to numbers like future revenue, earnings, margins and a fair value, then compare that fair value with the current price. You can keep it updated automatically as new earnings or news arrive, and see how different investors can reasonably disagree. For example, one community Narrative might lean closer to a higher fair value around US$97.35 based on stronger growth and a higher future P/E of 23.6x, while another might sit nearer US$62.00 using more cautious assumptions and a future P/E of 15.7x.
Do you think there's more to the story for A. O. Smith? Head over to our Community to see what others are saying!

This article by Simply Wall St is general in nature. We provide commentary based on historical data and analyst forecasts only using an unbiased methodology and our articles are not intended to be financial advice. It does not constitute a recommendation to buy or sell any stock, and does not take account of your objectives, or your financial situation. We aim to bring you long-term focused analysis driven by fundamental data. Note that our analysis may not factor in the latest price-sensitive company announcements or qualitative material. Simply Wall St has no position in any stocks mentioned.