Is AllianceBernstein (AB) Pricing In Too Much Optimism After Its Multi‑Year Share Gains?
AllianceBernstein Holding L.P. AB | 0.00 |
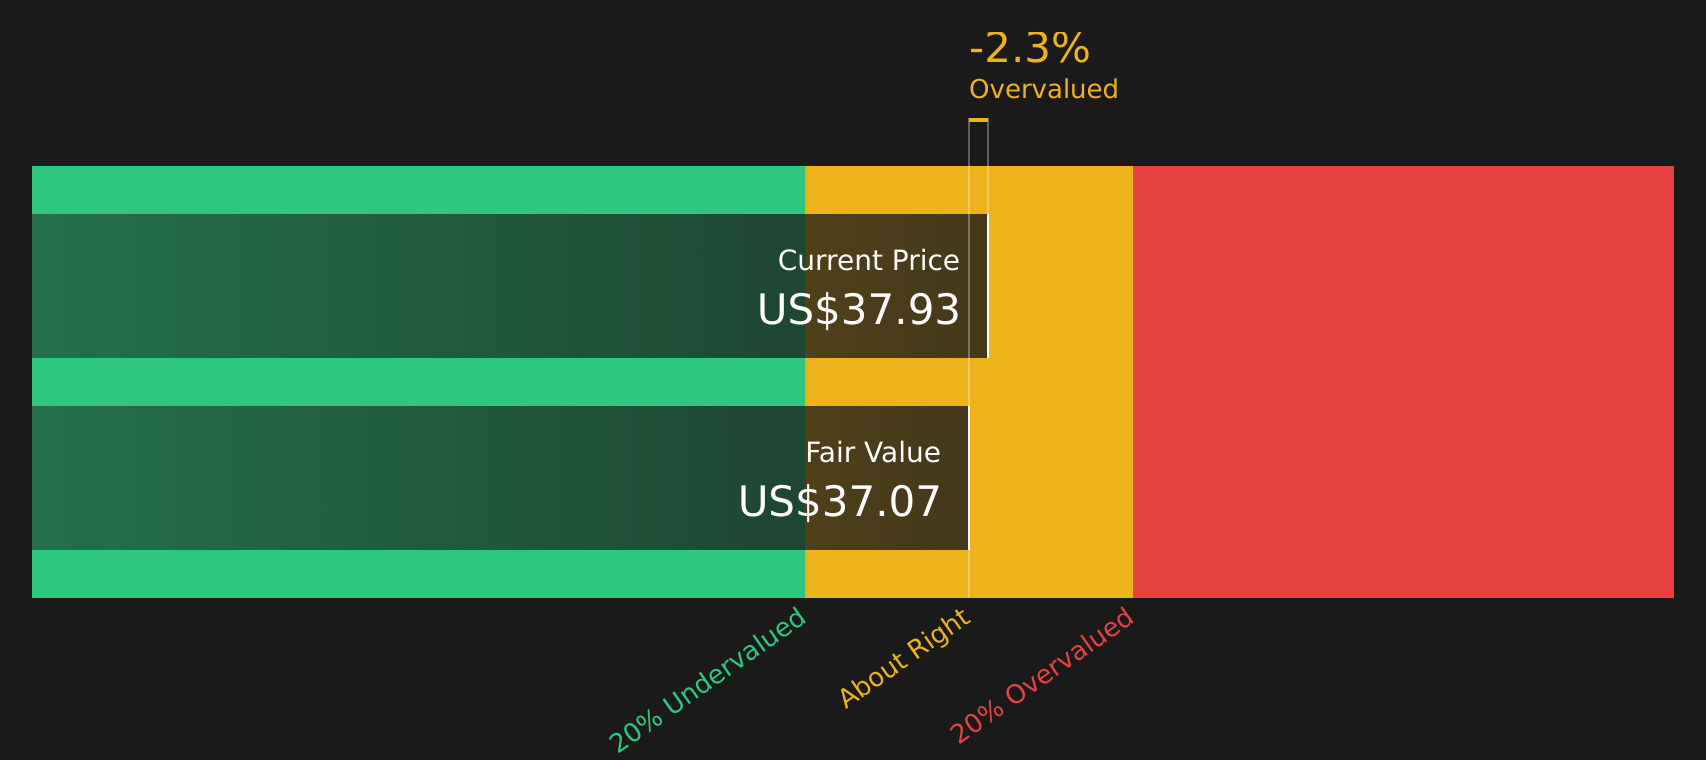
- If you are wondering whether AllianceBernstein Holding is fairly priced or if there is still value on the table, this breakdown will help you size up the stock with a clear focus on valuation.
- The share price recently closed at US$39.51, with returns of 1.8% over 7 days, 2.3% over 30 days, 2.3% year to date, 2.8% over 1 year, 48.8% over 3 years and 31.6% over 5 years.
- Recent coverage has focused on how AllianceBernstein fits into the broader capital markets sector and what that means for investors assessing risk and return. This context is important because it shapes how the market may be framing the stock's current price.
- On Simply Wall St's 6 point valuation checklist, AllianceBernstein Holding has a value score of 2/6. The next sections will walk through what that means using common valuation tools, and then finish with a more holistic way to think about value.
AllianceBernstein Holding scores just 2/6 on our valuation checks. See what other red flags we found in the full valuation breakdown.
Approach 1: AllianceBernstein Holding Excess Returns Analysis
The Excess Returns model looks at how efficiently a company uses shareholders' equity and whether those returns are high enough to clear the required cost of equity. Instead of focusing on cash flows, it compares what the business earns on its equity base with what investors require as compensation for risk.
For AllianceBernstein Holding, the model uses a Book Value of $13.42 per share and a Stable Book Value of $18.04 per share, both based on the median levels from the past 5 years. On this equity base, Stable EPS is $2.65 per share, sourced from the median return on equity over that period. The Average Return on Equity used in the model is 14.67%.
The Cost of Equity is set at $1.67 per share, which leads to an Excess Return of $0.97 per share. These recurring excess returns are capitalized over time to arrive at an intrinsic value estimate of about $34.61 per share under the Excess Returns Model.
Compared with the recent share price of $39.51, this framework suggests AllianceBernstein Holding is around 14.1% overvalued on this measure.
Result: OVERVALUED
Our Excess Returns analysis suggests AllianceBernstein Holding may be overvalued by 14.1%. Discover 50 high quality undervalued stocks or create your own screener to find better value opportunities.
Approach 2: AllianceBernstein Holding Price vs Earnings
For a profitable business like AllianceBernstein Holding, the P/E ratio is a useful way to think about what you are paying for each dollar of earnings. It ties the share price directly to current profitability, which is usually more stable than revenue or book value for established asset managers.
What counts as a “normal” P/E depends on how the market views a company’s growth prospects and risk profile. Higher expected growth or lower perceived risk can support a higher multiple, while slower growth or higher risk usually points to a lower one.
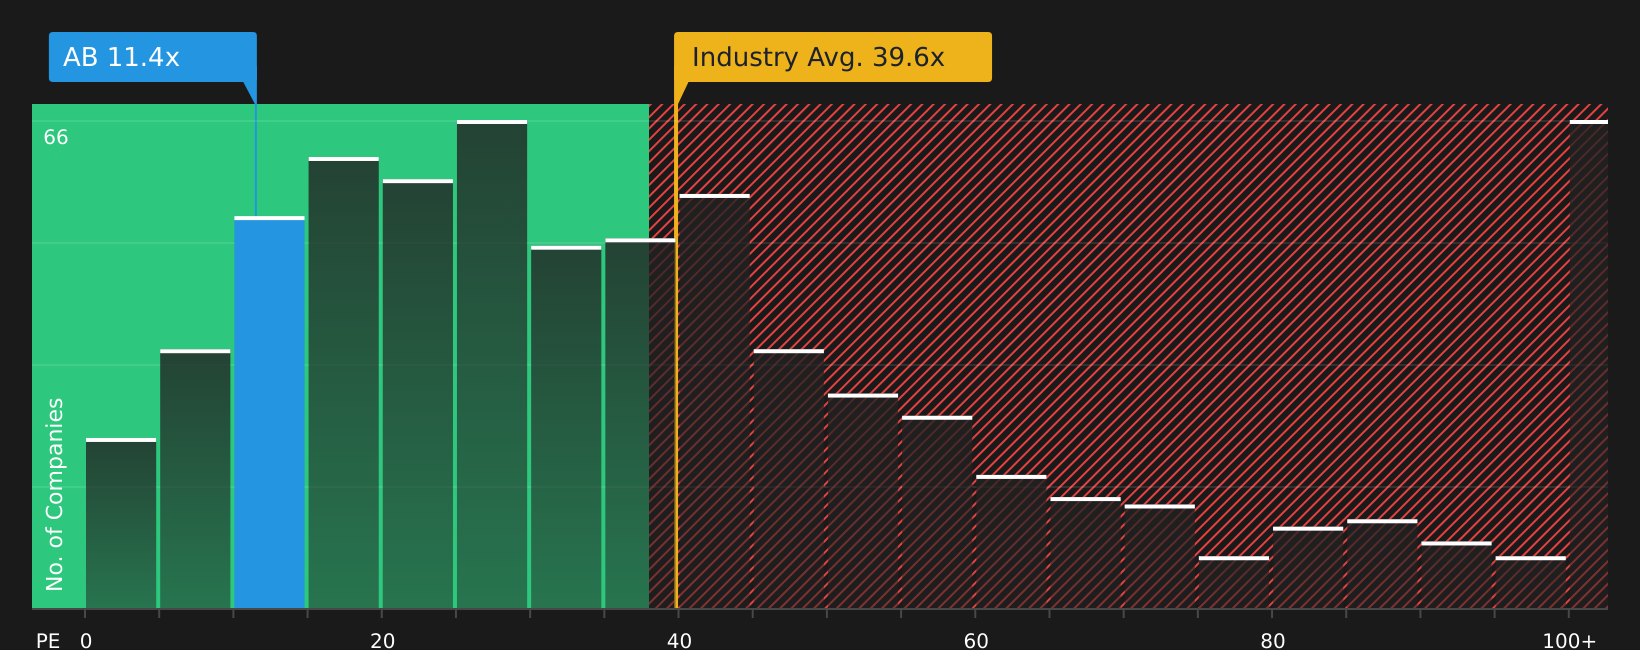
AllianceBernstein Holding currently trades on a P/E of 12.16x. That sits below the Capital Markets industry average P/E of 42.22x and below the peer group average of 17.44x. Simply Wall St’s Fair Ratio for AllianceBernstein Holding is 8.49x. This Fair Ratio is a proprietary estimate of what a suitable P/E might be after accounting for factors such as earnings growth, industry, profit margins, market cap and stock specific risks.
Compared with broad industry and peer averages, the Fair Ratio aims to be more tailored, because it adjusts for the company’s own fundamentals rather than assuming it should trade like the typical stock in its sector.
Since the actual P/E of 12.16x is above the Fair Ratio of 8.49x, this suggests the shares look overvalued on this measure.
Result: OVERVALUED
P/E ratios tell one story, but what if the real opportunity lies elsewhere? Start investing in legacies, not executives. Discover our 17 top founder-led companies.
Upgrade Your Decision Making: Choose your AllianceBernstein Holding Narrative
Earlier it was mentioned that there is an even better way to understand valuation. Think of a Narrative as your own story for AllianceBernstein Holding that links what you believe about its future revenue, earnings, margins and risks to a financial forecast, a fair value, and finally a clear comparison between that fair value and today’s price. This is all within an easy tool on Simply Wall St’s Community page that updates as new news or earnings arrive and can look very different from one investor to the next. For example, one investor might build a Narrative around the analyst consensus fair value of about US$38.79 with expectations for revenue of US$4.2b, earnings of US$275.1m, a 6.5% margin and a P/E of 13.1x by 2029. Another might focus more on risks such as fee pressure or equity outflows and arrive at a lower fair value, which then guides each person’s view on whether the current price looks high or low relative to their own assumptions.
Do you think there's more to the story for AllianceBernstein Holding? Head over to our Community to see what others are saying!

This article by Simply Wall St is general in nature. We provide commentary based on historical data and analyst forecasts only using an unbiased methodology and our articles are not intended to be financial advice. It does not constitute a recommendation to buy or sell any stock, and does not take account of your objectives, or your financial situation. We aim to bring you long-term focused analysis driven by fundamental data. Note that our analysis may not factor in the latest price-sensitive company announcements or qualitative material. Simply Wall St has no position in any stocks mentioned.