Is AllianceBernstein Holding (AB) Fairly Priced After Recent Share Price Weakness
AllianceBernstein Holding L.P. AB | 0.00 |
- If you are wondering whether AllianceBernstein Holding at around US$37.19 is attractively priced or asking too much for future returns, the starting point is understanding what the current valuation is actually baking in.
- The stock has been relatively steady over the past week with a 0.5% gain, while it has fallen 7.8% over the last month, is down 3.8% year to date, yet still shows a 2.4% return over one year, 39.4% over three years and 24.1% over five years.
- Recent coverage has focused on AllianceBernstein Holding's role in the broader capital markets sector and how asset managers are positioning themselves, which helps frame changing expectations around fee income and assets under management. This context matters because shifts in investor sentiment toward the sector can influence how much investors are willing to pay for the stock, even when company specific fundamentals look stable.
- According to Simply Wall St's valuation checks, AllianceBernstein Holding scores a 3 out of 6 on perceived undervaluation. The rest of this article will walk through the key valuation approaches behind that score, before finishing with a potentially more rounded way to think about what the stock is worth.
Approach 1: AllianceBernstein Holding Excess Returns Analysis
The Excess Returns model looks at how efficiently AllianceBernstein Holding turns shareholder capital into earnings, and then compares that to the return investors require. Instead of focusing on cash flows, it starts from book value and earnings power.
For AllianceBernstein Holding, the model uses a Book Value of $13.50 per share and a Stable EPS of $2.76 per share, based on the median return on equity from the past 5 years. The Average Return on Equity is 15.31%. Against a Cost of Equity of $1.66 per share, this produces an Excess Return of $1.10 per share, suggesting the company is earning more on its equity base than the model assumes investors require.
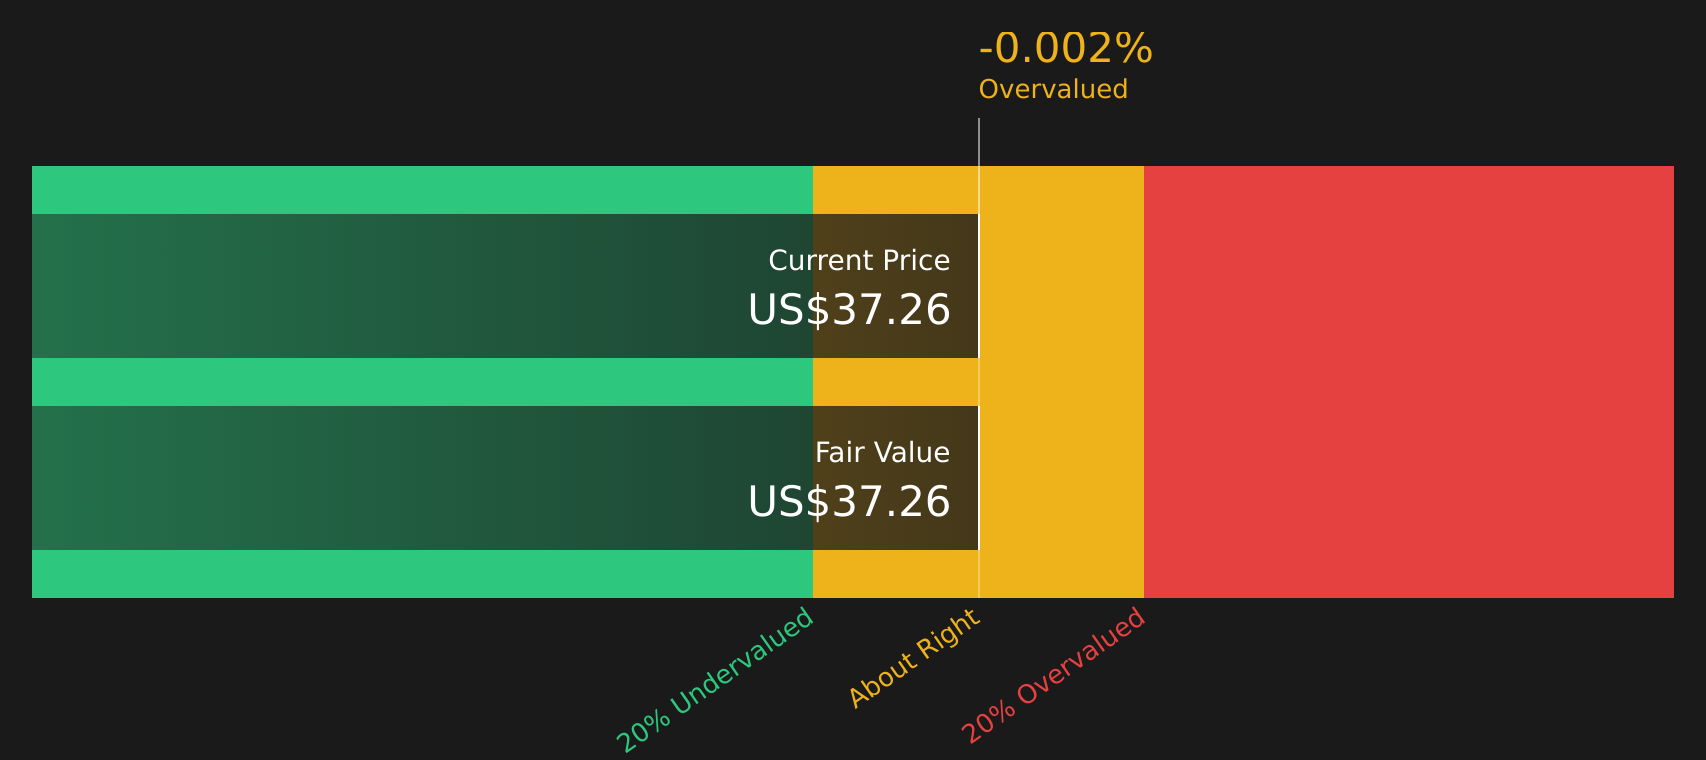
The analysis also uses a Stable Book Value of $18.00 per share, sourced from the median book value over the past 5 years, to estimate what those excess returns could be worth over time. This results in an intrinsic value estimate of about $37.34 per share. Compared with the current price around $37.19, the model indicates the stock is about 0.4% undervalued, which is effectively in line with today’s market pricing.
Result: ABOUT RIGHT
AllianceBernstein Holding is fairly valued according to our Excess Returns, but this can change at a moment's notice. Track the value in your watchlist or portfolio and be alerted on when to act.
Approach 2: AllianceBernstein Holding Price vs Earnings
For profitable companies, the P/E ratio is a useful shorthand for how much investors are paying today for each dollar of earnings. It links directly to what matters most to equity holders, the earnings that support dividends and potential reinvestment.
What counts as a "normal" or "fair" P/E depends on how investors view a company’s growth prospects and risk. Higher expected growth or lower perceived risk can support a higher multiple, while lower growth or higher risk usually points to a lower P/E.
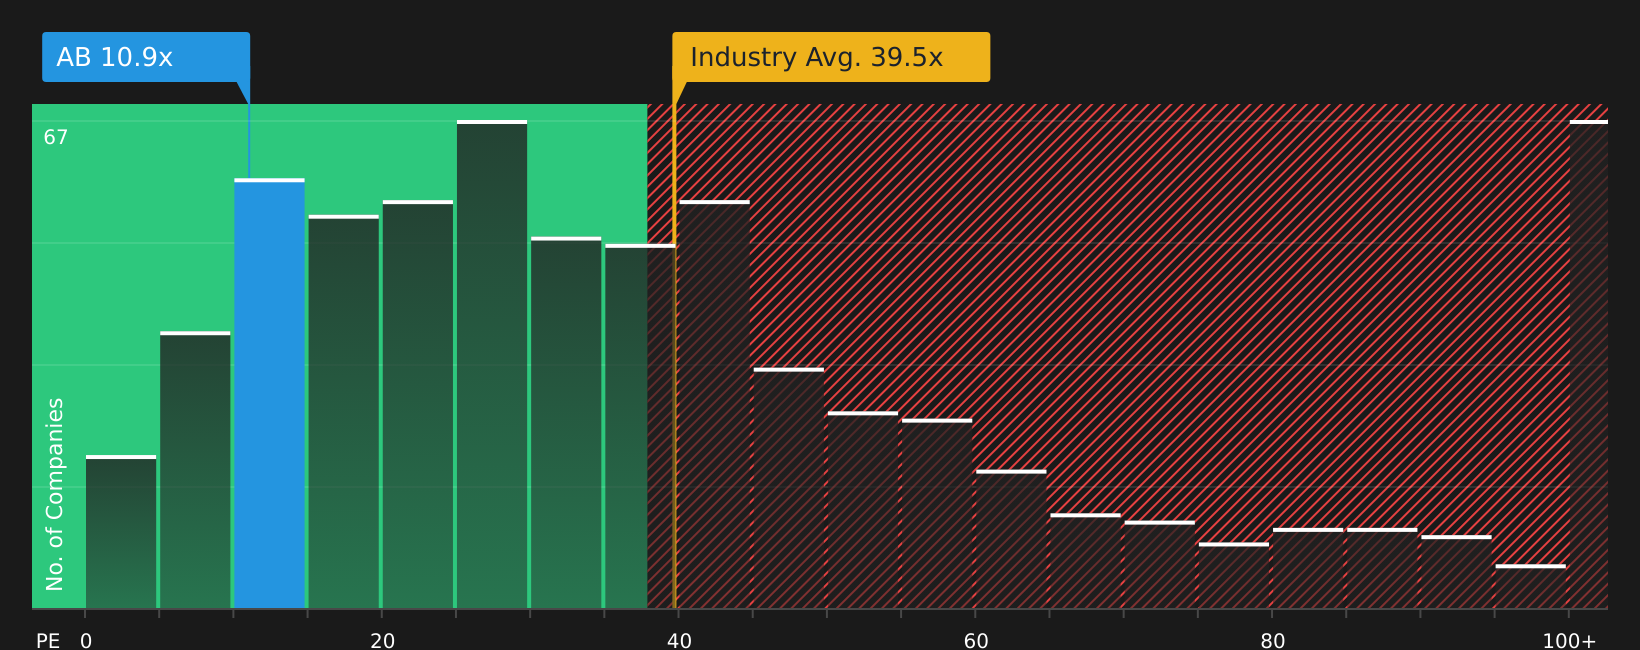
AllianceBernstein Holding currently trades on a P/E of 11.17x. That is below the Capital Markets industry average P/E of 39.14x and also below the peer group average of 18.06x. Simply Wall St’s proprietary Fair Ratio for AllianceBernstein Holding is 8.78x, which reflects factors such as the company’s earnings profile, industry, profit margins, market cap and specific risks. This Fair Ratio can be more useful than a simple comparison with peers or the broad industry because it adjusts for company specific characteristics rather than assuming all stocks deserve the same multiple. On this basis, the current 11.17x P/E is higher than the 8.78x Fair Ratio, which indicates a richer valuation than that model would suggest.
Result: OVERVALUED
Wall Street's queuing for one rocket. While SpaceX counts down to its IPO, other companies tied to the new space race are already in orbit. → 20 Compelling Space Companies watchlist · Global Space Race Investing Ideas screener · Scan the sector by valuation on Rocket Lab's valuation page.
Upgrade Your Decision Making: Choose your AllianceBernstein Holding Narrative
Earlier it was mentioned that there is an even better way to understand valuation. Consider Narratives, which let you attach a clear story about AllianceBernstein Holding to the numbers you care about by linking your view on its future revenue, earnings and margins to a financial forecast, a fair value, and a simple comparison with today’s price. This is all available within an easy tool on Simply Wall St’s Community page that is used by millions of investors, updates automatically when fresh news or earnings arrive, and can reflect very different perspectives. For example, one investor might lean toward the analyst consensus fair value around US$39.43 based on revenue reaching US$4.4b, earnings of US$275.0m and a 13.3x P/E by 2029. Another might prefer a much lower fair value if they are more cautious about AUM growth, fee rates or buybacks. Comparing each of these fair values to the current share price can then help you decide whether the stock looks appealing, expensive, or somewhere in between for your own approach.
Do you think there's more to the story for AllianceBernstein Holding? Head over to our Community to see what others are saying!

This article by Simply Wall St is general in nature. We provide commentary based on historical data and analyst forecasts only using an unbiased methodology and our articles are not intended to be financial advice. It does not constitute a recommendation to buy or sell any stock, and does not take account of your objectives, or your financial situation. We aim to bring you long-term focused analysis driven by fundamental data. Note that our analysis may not factor in the latest price-sensitive company announcements or qualitative material. Simply Wall St has no position in any stocks mentioned.