

Is American Tower (AMT) Cheap After Its Russell Index Additions Ahead Of Earnings?
American Tower Corporation AMT | 0.00 |
American Tower (AMT) has just been added to several Russell value and defensive indices, drawing fresh attention to the stock as it posts a 1.53% session gain ahead of its July 28 earnings report.
Looking beyond the latest session, American Tower’s share price is down 14.47% over the past 30 days and 5.02% year to date, while the 1 year total shareholder return has declined 22.24%. This suggests momentum has been fading even as the new index inclusions put a spotlight on its value and defensive profile.
If you are tracking how communications and infrastructure themes play out beyond American Tower, this is a good moment to see which other AI infrastructure stocks are on investors’ radar through the 52 AI infrastructure stocks.
With American Tower now trading below some intrinsic and analyst value estimates despite ongoing revenue and net income growth, the key question is whether the stock is genuinely undervalued or whether the market is already pricing in future growth.
Price to Earnings of 26.7x: Is it justified for American Tower?
On simple valuation checks, American Tower looks inexpensive relative to several benchmarks, with the stock trading at a P/E of 26.7x while screens flag it as trading at a discount to both internal fair value estimates and analyst targets.
The P/E ratio compares what investors are paying today for each dollar of earnings. For a mature, income focused REIT like American Tower, it is a quick way to see how the market is weighing current profits against future expectations.
Here, the 26.7x P/E is described as good value versus the peer average of 33.3x, the broader US Specialized REITs industry average of 30.1x, and an estimated fair P/E of 35.3x that the SWS model suggests could be a level the multiple might gravitate toward if sentiment and assumptions stayed intact.
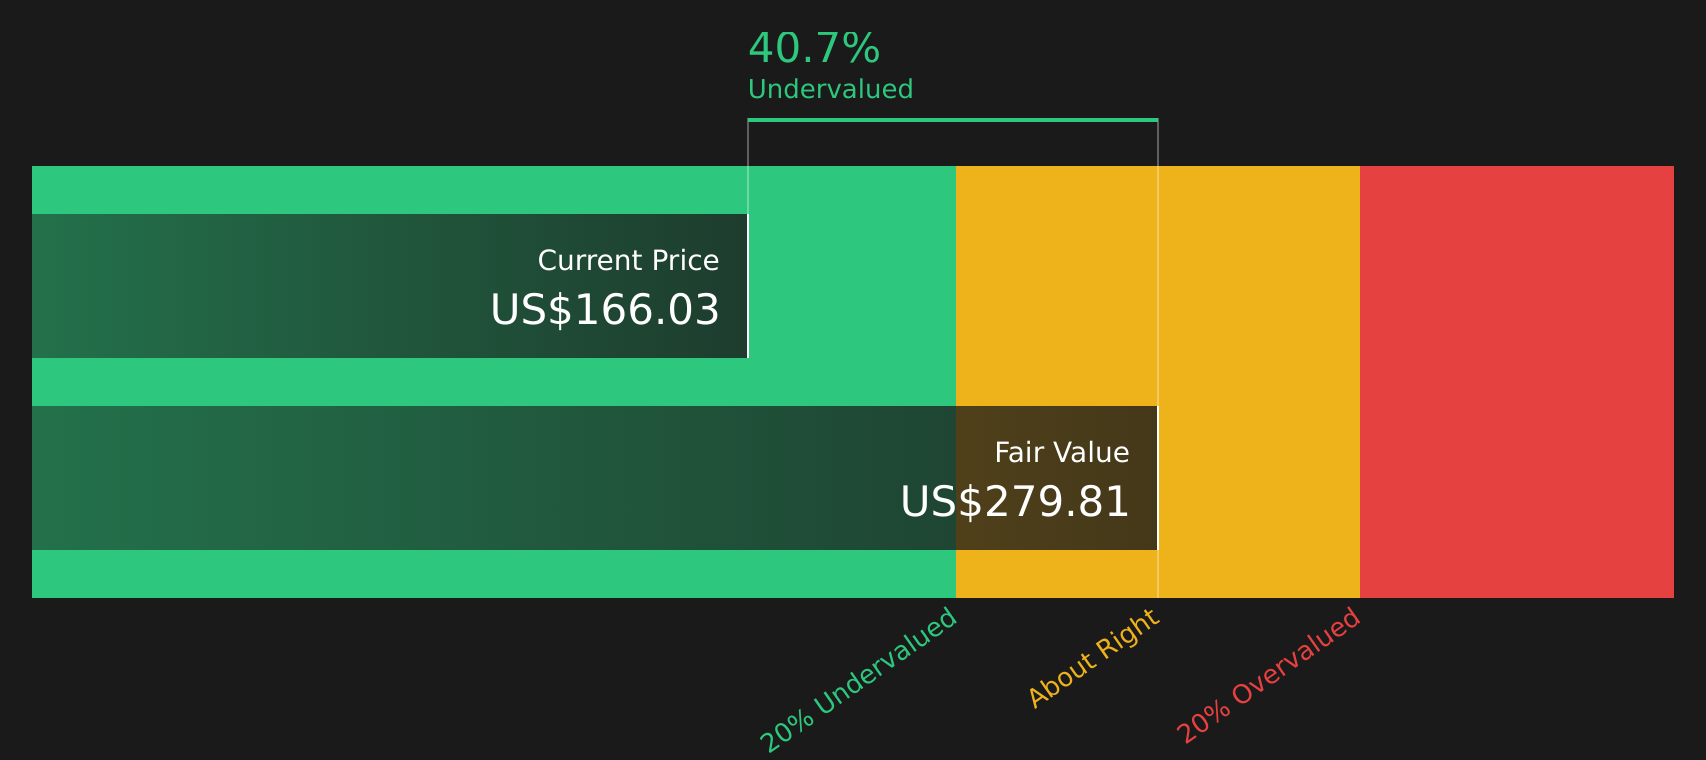
That combination, alongside American Tower trading 40.7% below an internal fair value estimate and 30.6% below the analyst consensus price target, positions the current P/E as relatively undemanding compared with both peers and the modelled fair multiple.
Result: Price-to-Earnings of 26.7x (UNDERVALUED)
However, investors still need to watch for risks such as tenant consolidation and any slowdown in American Tower’s property or services operations that challenges current valuation assumptions.
Another View: What the SWS DCF Model Says About American Tower
Alongside the relatively low P/E multiple, the SWS DCF model values American Tower’s future cash flows at $279.81 per share, compared with the current price of $166.03. That framing points to the stock trading at a discount, but it also raises a question about how much faith to place in long term cash flow assumptions.
Simply Wall St performs a discounted cash flow (DCF) on every stock in the world every day (check out American Tower for example). We show the entire calculation in full. You can track the result in your watchlist or portfolio and be alerted when this changes, or use our stock screener to discover 44 high quality undervalued stocks. If you save a screener we even alert you when new companies match - so you never miss a potential opportunity.
Next Steps
With mixed signals around American Tower’s valuation and outlook, the real opportunity is to review the details yourself and act before sentiment shifts. To see how the balance of concern and optimism stacks up in one place, take a look at the 6 key rewards and 1 important warning sign.
Looking for more investment ideas beyond American Tower?
If you stop with American Tower, you risk missing other opportunities that could fit your goals just as well or even better.
- Spot potential bargains early by scanning companies that screen as 44 high quality undervalued stocks before wider attention arrives.
- Strengthen your income focus by reviewing stocks that qualify as 7 dividend fortresses with yields that stand out.
- Protect your downside by concentrating on companies highlighted in the 74 resilient stocks with low risk scores that score well on risk checks.
This article by Simply Wall St is general in nature. We provide commentary based on historical data and analyst forecasts only using an unbiased methodology and our articles are not intended to be financial advice. It does not constitute a recommendation to buy or sell any stock, and does not take account of your objectives, or your financial situation. We aim to bring you long-term focused analysis driven by fundamental data. Note that our analysis may not factor in the latest price-sensitive company announcements or qualitative material. Simply Wall St has no position in any stocks mentioned.