Is Ashland (ASH) Offering A Compelling Entry Point After Mixed Multi‑Year Returns?
Ashland Inc. ASH | 54.39 | -1.89% |
- If you are wondering whether Ashland shares offer good value today, it helps to start by looking at what the recent price action and fundamentals might be telling you.
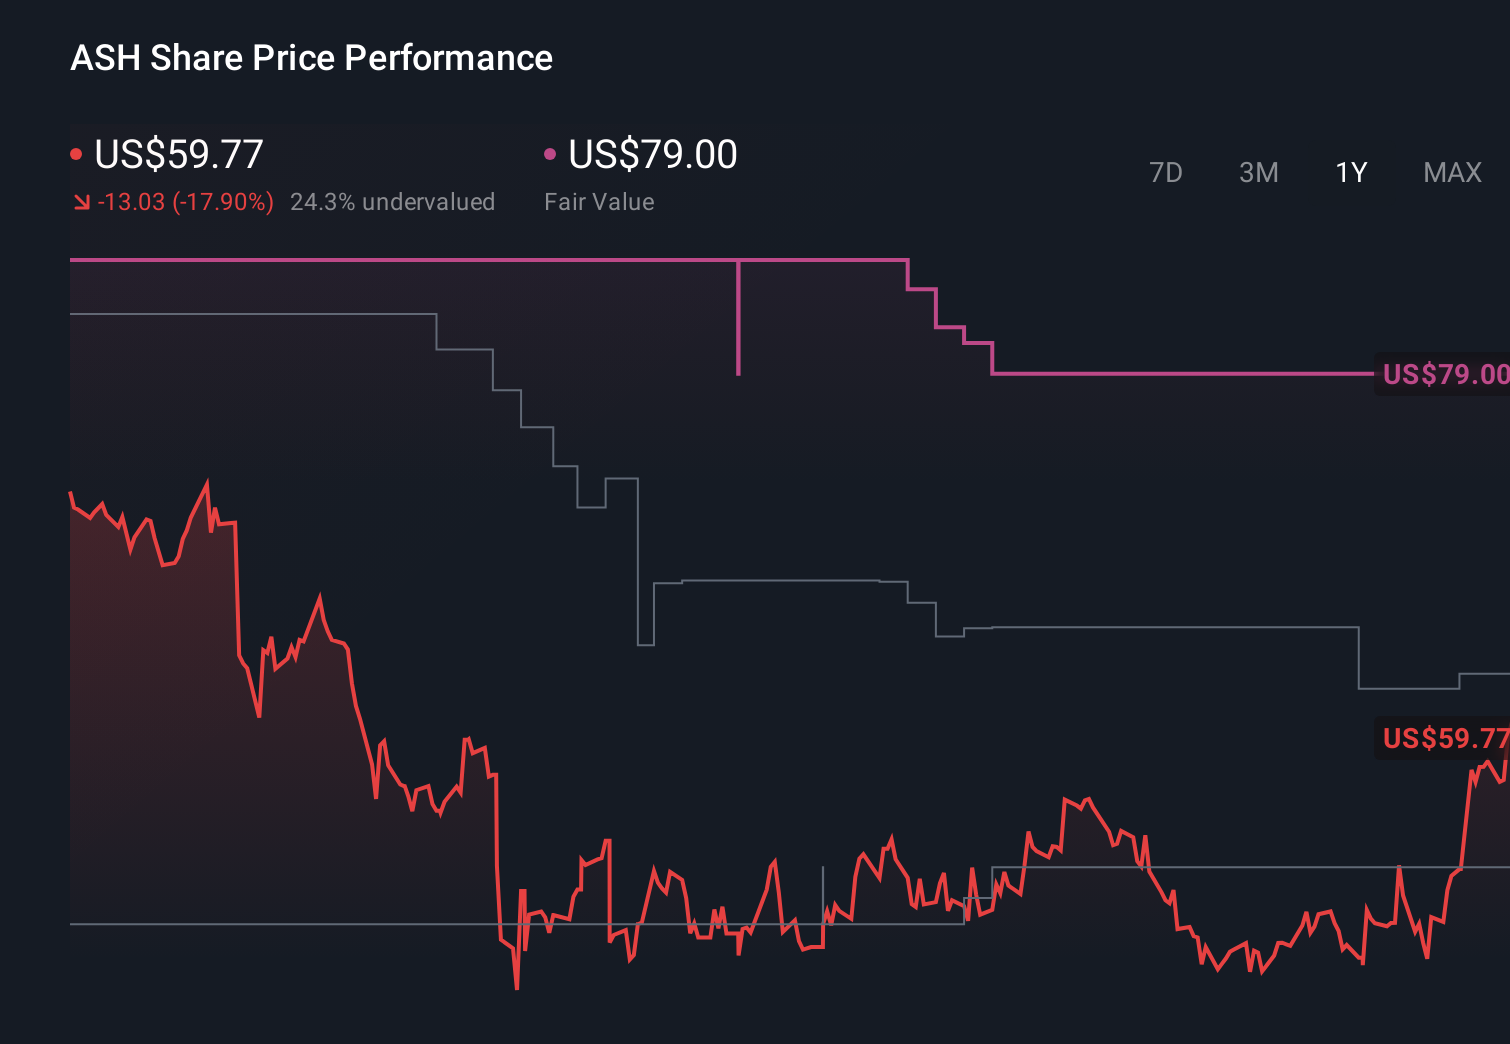
- The stock last closed at US$61.16, with a 7 day return of a 3.4% decline, a 30 day return of 4.2% and year to date and 1 year returns of 2.2% and a 0.7% decline, while the 3 year and 5 year returns sit at a 38.0% decline and a 21.2% decline.
- These mixed returns set the backdrop for assessing whether the current price fairly reflects Ashland's business today. Recent company specific news helps explain why sentiment may have shifted at different points, giving context to both shorter term moves and the longer term performance you see in the return figures.
- On our valuation checks, Ashland scores 2 out of 6. You can see this in more detail in our valuation score. Next we will walk through what different valuation approaches say about the stock before finishing with a way to think about valuation that brings all of these views together.
Ashland scores just 2/6 on our valuation checks. See what other red flags we found in the full valuation breakdown.
Approach 1: Ashland Discounted Cash Flow (DCF) Analysis
A Discounted Cash Flow model estimates what a company could be worth today by projecting its future cash flows and then discounting those back to a present value.
For Ashland, the model used is a 2 Stage Free Cash Flow to Equity approach. The latest twelve month free cash flow is a loss of $26.55 million, so the DCF relies heavily on future estimates rather than recent cash generation. Analyst inputs and extrapolations indicate free cash flow of $338.00 million in 2028, with a series of projected annual cash flows between 2026 and 2035 all in the hundreds of millions of dollars. Simply Wall St extends analyst estimates beyond year five using its own growth assumptions to build a 10 year cash flow path.
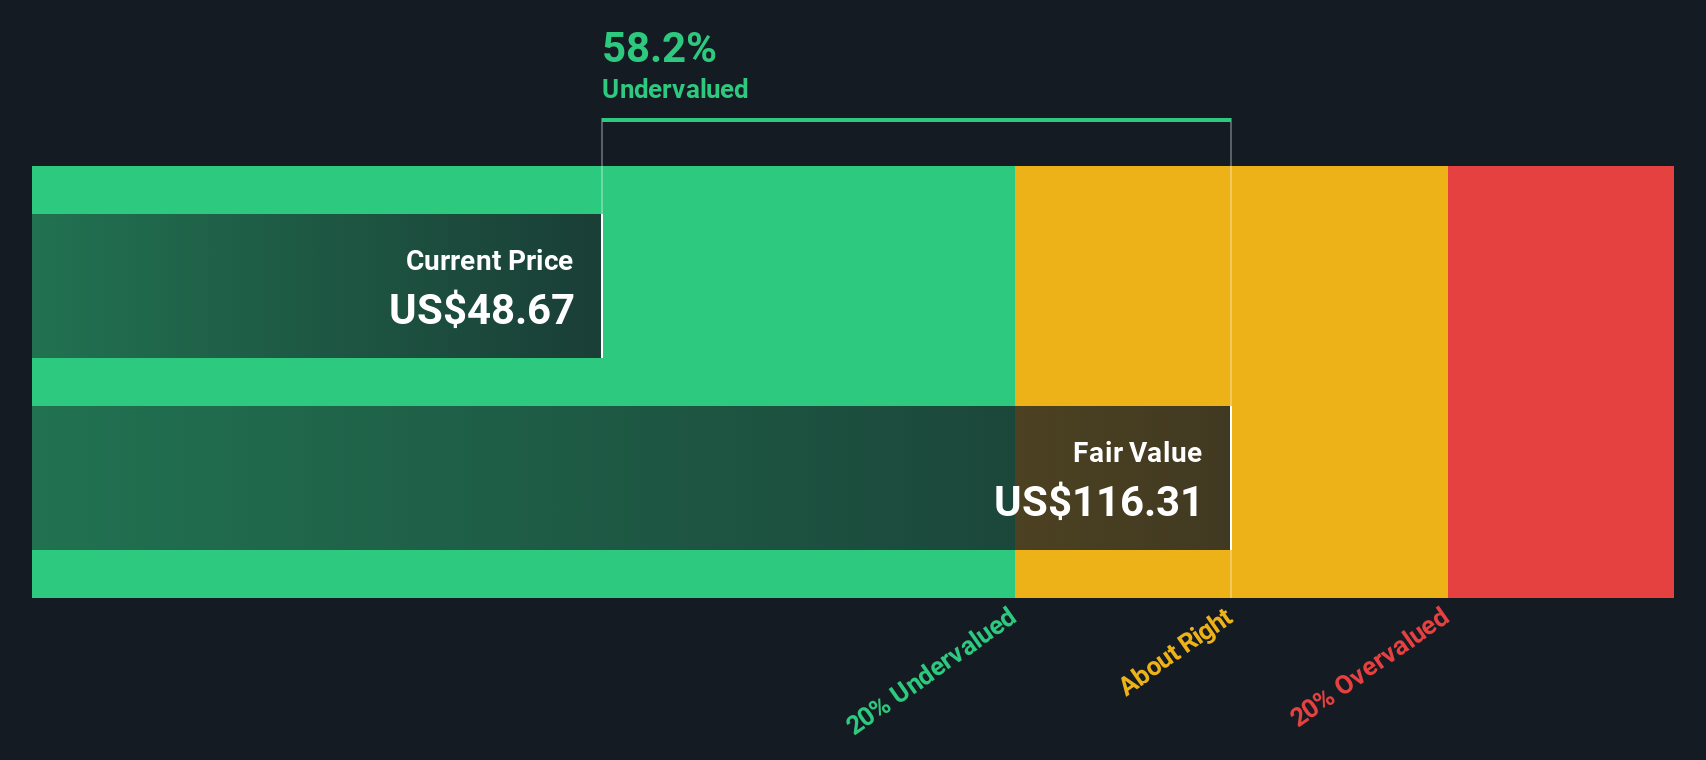
Discounting those projected cash flows back to today results in an estimated intrinsic value of $182.48 per share. Compared with the recent share price of $61.16, the model implies the stock is about 66.5% undervalued on this basis.
Result: UNDERVALUED
Our Discounted Cash Flow (DCF) analysis suggests Ashland is undervalued by 66.5%. Track this in your watchlist or portfolio, or discover 868 more undervalued stocks based on cash flows.
Approach 2: Ashland Price vs Sales
For companies where earnings can be uneven, the P/S ratio is often a useful way to think about value, because it compares what you pay for each dollar of revenue rather than profit. Investors usually accept a higher or lower P/S depending on what they expect for future growth and how risky those future sales look, so there is no single "right" multiple.
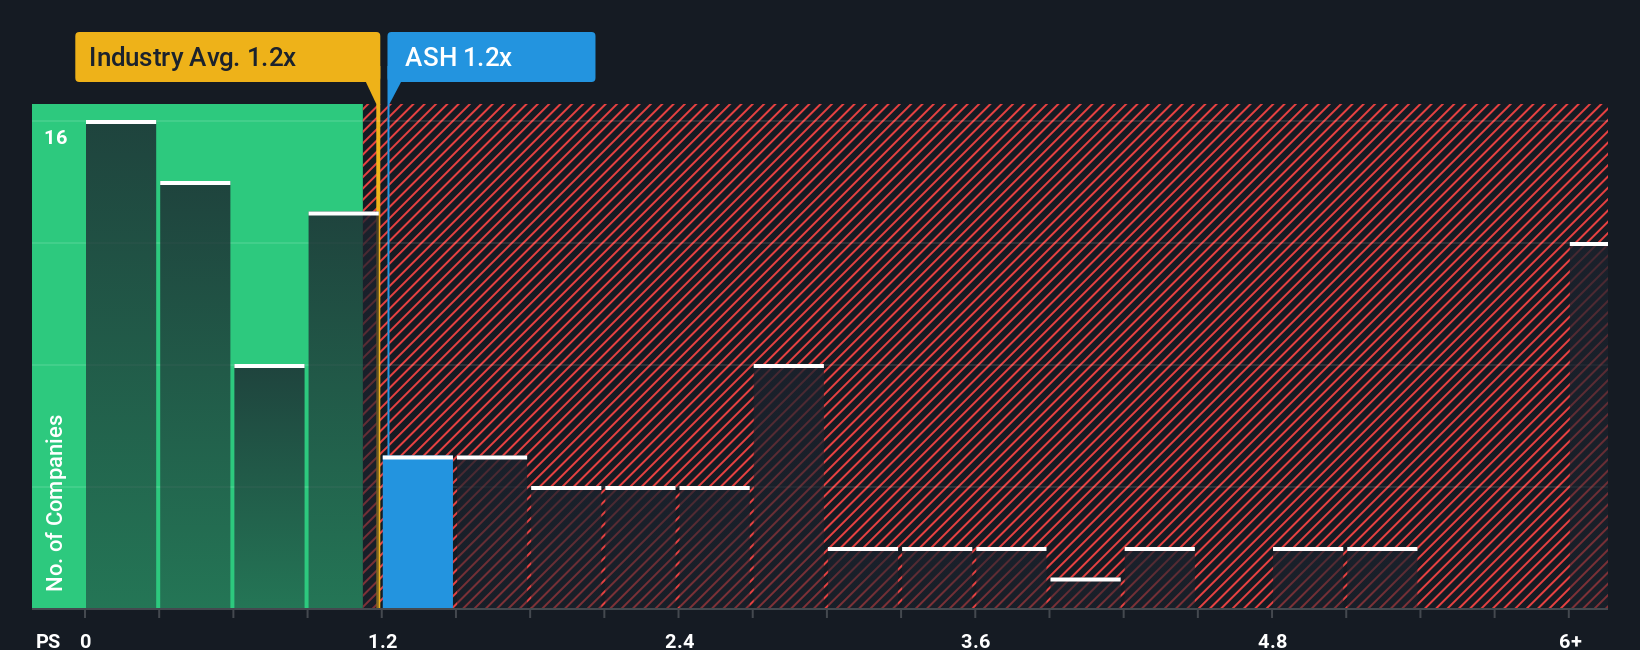
Ashland currently trades on a P/S of 1.53x. That sits above the Chemicals industry average of 1.14x and also above the peer group average of 1.28x, so on a simple comparison the shares are priced higher than many sector alternatives on a sales basis.
Simply Wall St’s Fair Ratio for Ashland is 1.35x. This is a proprietary estimate of what a reasonable P/S might be, given factors such as the company’s earnings profile, industry, profit margins, market value and risk characteristics. Because it adjusts for these fundamentals, the Fair Ratio can be more informative than a plain industry or peer average, which treat all companies as if they were identical. Compared with Ashland’s actual P/S of 1.53x, the Fair Ratio points to the shares being somewhat expensive on this metric.
Result: OVERVALUED
P/S ratios tell one story, but what if the real opportunity lies elsewhere? Discover 1417 companies where insiders are betting big on explosive growth.
Upgrade Your Decision Making: Choose your Ashland Narrative
Earlier we mentioned that there is an even better way to understand valuation, so let us introduce you to Narratives, which simply means writing the story you believe about Ashland and tying that story directly to the numbers you use, such as fair value, future revenue, earnings and margins.
On Simply Wall St, available to millions of investors on the Community page, a Narrative is your linked chain of ideas, from how you think Ashland’s business will develop, to a financial forecast, to a fair value that you can then compare with today’s share price.
The comparison between your fair value and the current price can help you consider whether Ashland appears attractive, fully priced or expensive to you. Because Narratives update automatically when new information such as earnings or news is added, your view can stay current without you rebuilding every assumption from scratch.
For example, one Ashland Narrative on the Community page might assume a higher fair value with stronger revenue and margins, while another uses more cautious assumptions that lead to a lower fair value, and seeing both side by side can help you decide which story you find more reasonable.
Do you think there's more to the story for Ashland? Head over to our Community to see what others are saying!
This article by Simply Wall St is general in nature. We provide commentary based on historical data and analyst forecasts only using an unbiased methodology and our articles are not intended to be financial advice. It does not constitute a recommendation to buy or sell any stock, and does not take account of your objectives, or your financial situation. We aim to bring you long-term focused analysis driven by fundamental data. Note that our analysis may not factor in the latest price-sensitive company announcements or qualitative material. Simply Wall St has no position in any stocks mentioned.