Is Banner (BANR) Offering A Potential Opportunity After Recent Share Price Weakness
Banner Corporation BANR | 61.60 | +0.33% |
- Investors may be wondering whether Banner's share price reflects its true worth, or if the recent weakness has opened up a potential value opportunity for patient investors.
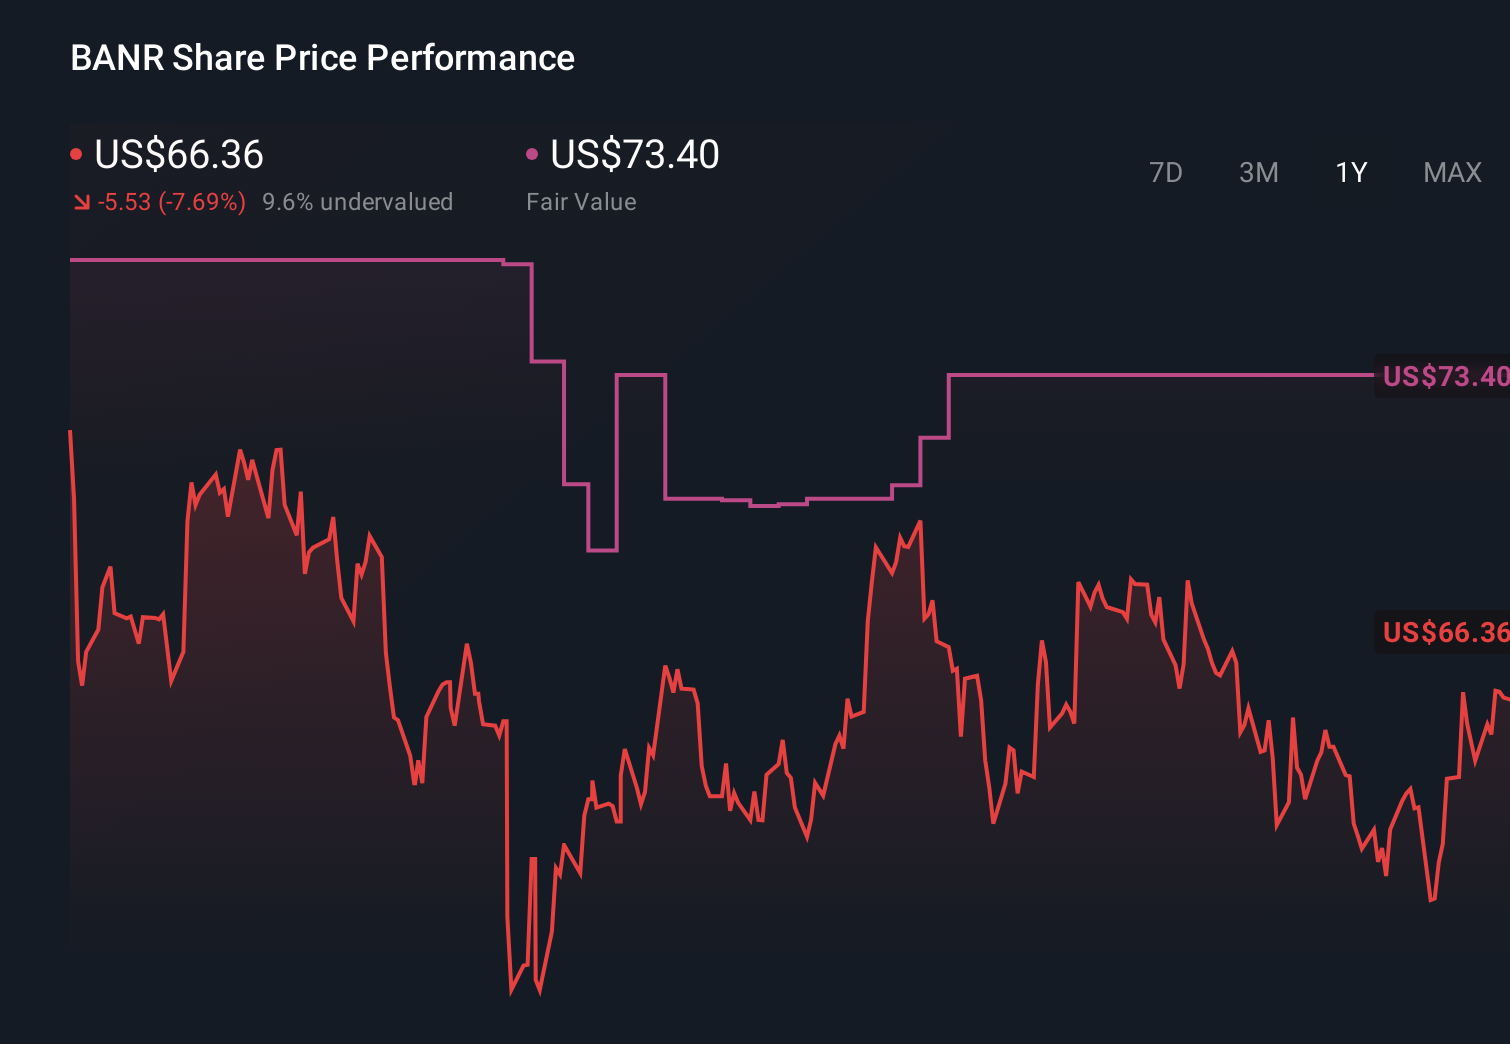
- The stock closed at US$61.72, with a 6.7% decline over the past 7 days, a 2.3% decline over 30 days, a 1.2% decline year to date, and a 10.4% decline over 1 year. The 3 year and 5 year returns sit at 3.3% and 49.8% respectively.
- Recent coverage of the regional banking sector has kept investor attention on balance sheet strength, interest rate sensitivity, and deposit stability. These factors often influence sentiment toward banks such as Banner. Broader discussions around regulation and credit conditions have also been in focus, giving context to the share price moves over the past year.
- On Simply Wall St's 6 point valuation check, Banner scores a 5 out of 6. Next, we will look at what the different valuation approaches say about the stock and how an even richer way of thinking about valuation comes together at the end of this article.
Approach 1: Banner Excess Returns Analysis
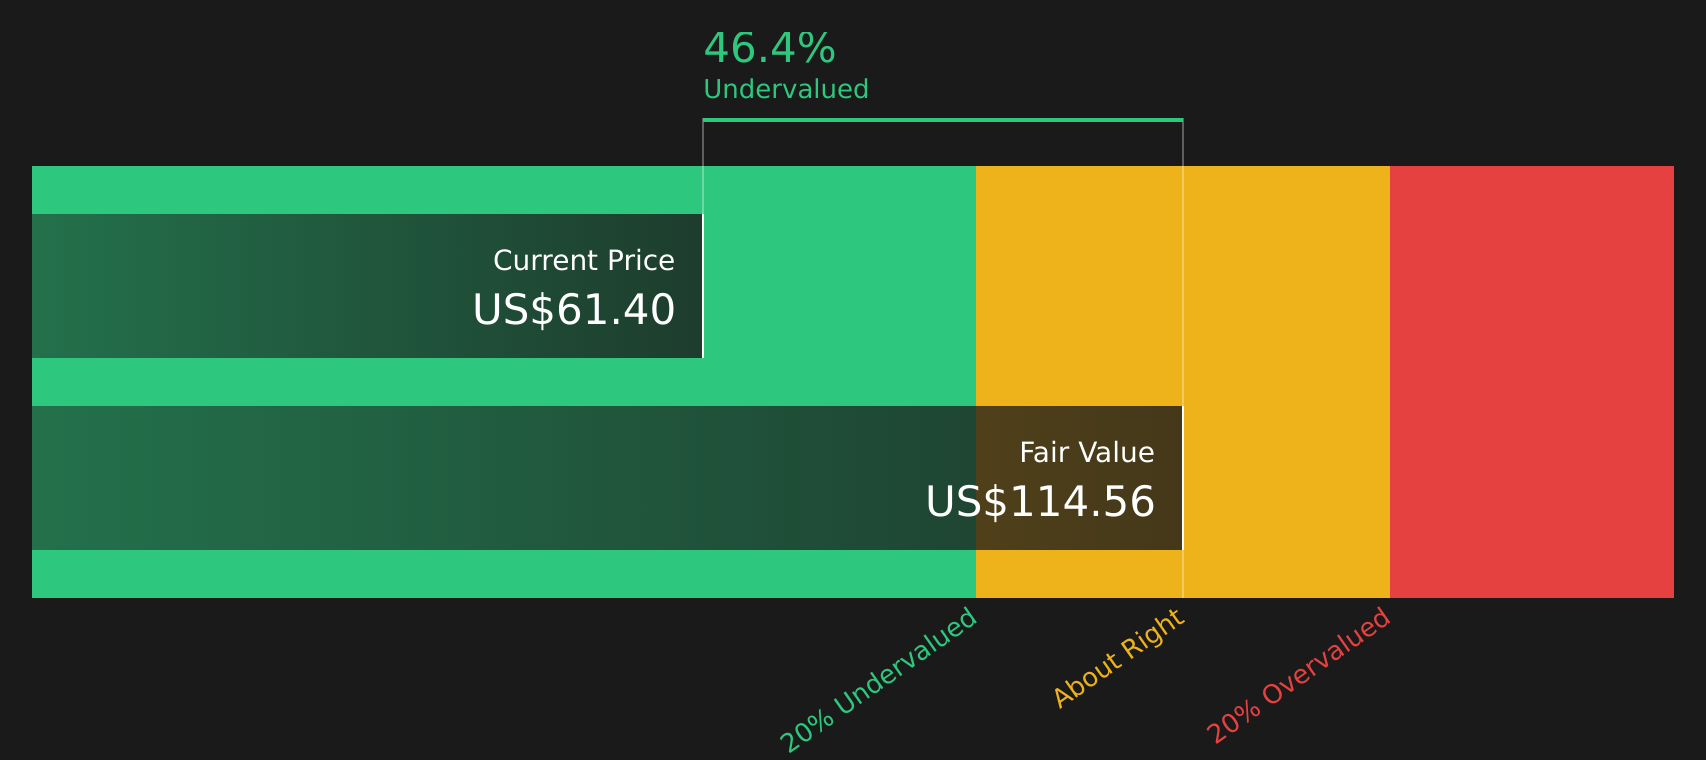
The Excess Returns model looks at how much profit a company is expected to earn above its cost of equity, and then capitalizes those extra profits into an intrinsic value per share.
For Banner, the model uses a Book Value of US$57.08 per share and a Stable EPS of US$6.27 per share, based on weighted future Return on Equity estimates from 4 analysts. The Average Return on Equity used is 9.80%, while the Cost of Equity is set at US$4.45 per share. That leaves an Excess Return of US$1.82 per share that the bank is expected to generate over and above what investors require.
The model also assumes a Stable Book Value of US$63.92 per share, sourced from weighted future Book Value estimates from 5 analysts. Using these inputs together, the Excess Returns framework arrives at an intrinsic value of about US$113.19 per share.
Compared with the recent share price of US$61.72, this indicates the stock is 45.5% undervalued according to this approach.
Result: UNDERVALUED
Our Excess Returns analysis suggests Banner is undervalued by 45.5%. Track this in your watchlist or portfolio, or discover 866 more undervalued stocks based on cash flows.
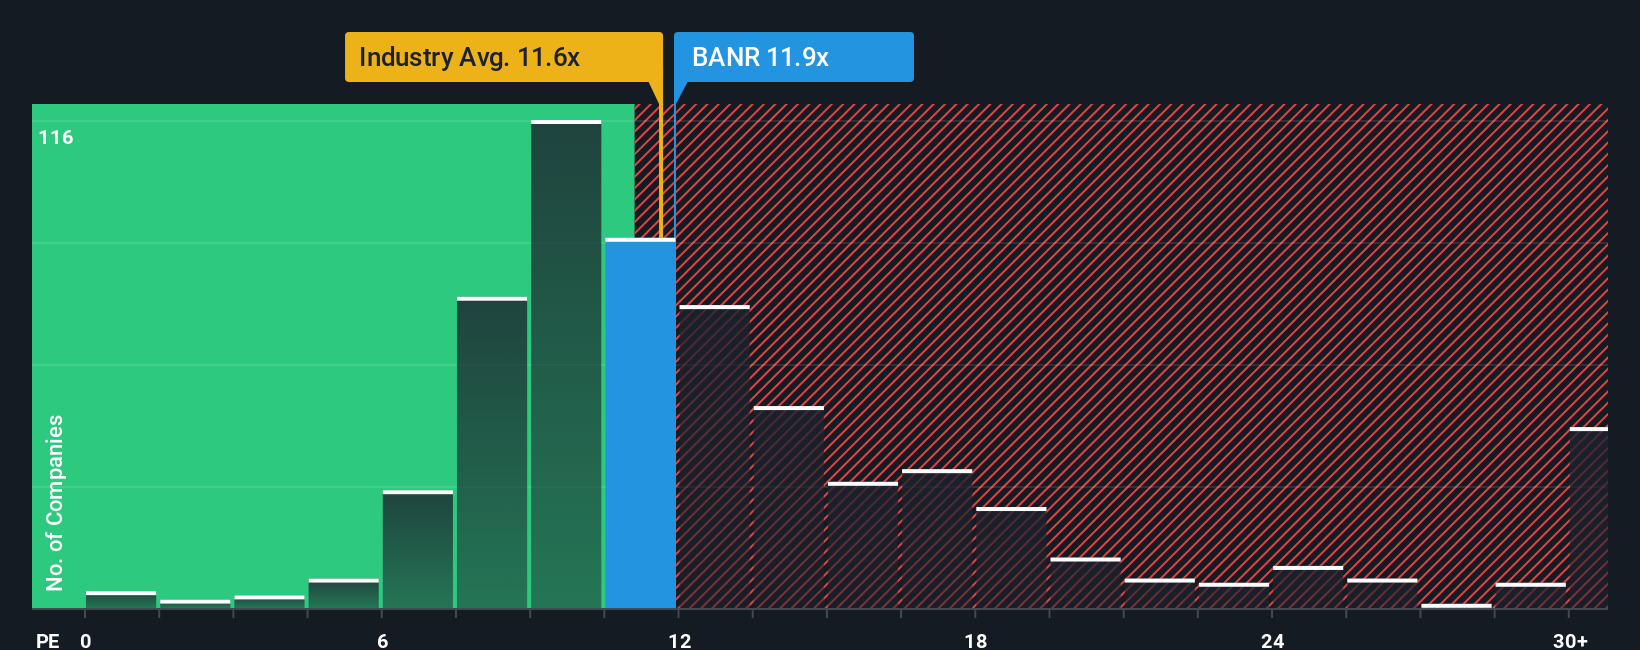
Approach 2: Banner Price vs Earnings
For a profitable bank like Banner, the P/E ratio is a useful shorthand for what investors are currently willing to pay for each dollar of earnings. It connects directly to the bottom line, which is often how shareholders think about value in established lenders.
What counts as a “normal” P/E depends on what investors expect for future earnings and how much risk they see in those earnings. Higher expected growth or lower perceived risk can justify a higher P/E, while slower growth or higher risk can justify a lower one.
Banner currently trades on a P/E of 10.77x. This is below the Banks industry average of 11.73x and also below the peer group average of 13.05x. Simply Wall St’s Fair Ratio for Banner is 11.22x, which is the P/E level its model suggests based on factors such as earnings growth, industry, profit margins, market cap and risk profile.
The Fair Ratio aims to be more tailored than a simple comparison with peers or the industry, because it adjusts for company specific characteristics rather than assuming one size fits all. Comparing Banner’s actual P/E of 10.77x with the Fair Ratio of 11.22x suggests the shares trade below that model based reference point.
Result: UNDERVALUED
P/E ratios tell one story, but what if the real opportunity lies elsewhere? Discover 1412 companies where insiders are betting big on explosive growth.
Upgrade Your Decision Making: Choose your Banner Narrative
Earlier we mentioned that there is an even better way to understand valuation, so let us introduce you to Narratives, which are simply the story you believe about a company tied directly to your own assumptions for its fair value, future revenue, earnings and margins.
A Narrative on Simply Wall St connects three things: the company’s story, a financial forecast built from your assumptions, and a resulting fair value that you can compare with today’s share price.
You can create and explore Narratives on the Community page of Simply Wall St, where millions of investors share their views in a format that is easy to read, easy to adjust and automatically updates when new information like earnings or news arrives.
Narratives can then help you decide whether you might want to buy or sell by showing you, in one place, how your view of fair value stacks up against the current market price.
For example, one Banner Narrative might assume a higher fair value based on relatively optimistic revenue and margin estimates, while another uses more cautious assumptions and a lower fair value, illustrating how different investors can look at the same bank and reach very different conclusions about what the shares are worth.
Do you think there's more to the story for Banner? Head over to our Community to see what others are saying!
This article by Simply Wall St is general in nature. We provide commentary based on historical data and analyst forecasts only using an unbiased methodology and our articles are not intended to be financial advice. It does not constitute a recommendation to buy or sell any stock, and does not take account of your objectives, or your financial situation. We aim to bring you long-term focused analysis driven by fundamental data. Note that our analysis may not factor in the latest price-sensitive company announcements or qualitative material. Simply Wall St has no position in any stocks mentioned.