Is BrightView (BV) Offering An Opportunity After Recent Commercial Services Valuation Check
BrightView Holdings BV | 11.71 | -0.51% |
- If you have been wondering whether BrightView Holdings is attractively priced or not, this article will walk through what the current share price might imply about its value.
- The stock closed at US$13.55, with returns of 1.4% over 7 days, 4.8% over 30 days, 7.5% year to date, a 7.1% decline over 1 year, a very large gain over 3 years, and a 13.7% decline over 5 years.
- Recent news around BrightView has focused on its position as a large commercial landscaping provider and ongoing interest from investors who follow service businesses tied to property and infrastructure activity. This context helps frame why the share price has moved over different time frames and why some investors are reassessing the balance between potential and risk.
- On our valuation checks, BrightView scores a 5 out of 6. This suggests there is more to unpack when you compare different valuation methods and, later on, a way of thinking about valuation that can give you a clearer long term view.
Approach 1: BrightView Holdings Discounted Cash Flow (DCF) Analysis
A Discounted Cash Flow, or DCF, model looks at the cash BrightView Holdings is expected to generate in the future and discounts those cash flows back to today to arrive at an estimate of what the business might be worth now.
For BrightView, the latest twelve month Free Cash Flow is about $126.2 million. Analysts provide explicit estimates out to 2027, with Free Cash Flow for the year to 30 September 2027 projected at $153.8 million. Beyond that, Simply Wall St extends the view using its own assumptions, with ten year cash flow projections that run from $102.8 million in 2026 through to $253.6 million in 2035.
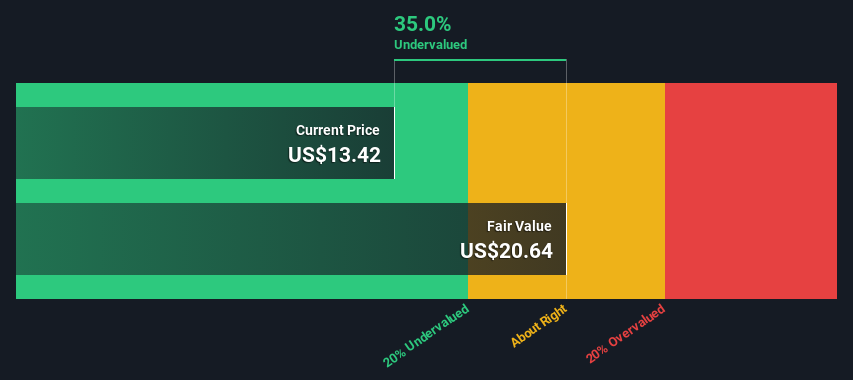
Using a 2 Stage Free Cash Flow to Equity model built on these projected cash flows, Simply Wall St arrives at an estimated intrinsic value of about $39.99 per share. Compared with the recent share price of US$13.55, this model suggests the stock is 66.1% undervalued on a cash flow basis.
Result: UNDERVALUED
Our Discounted Cash Flow (DCF) analysis suggests BrightView Holdings is undervalued by 66.1%. Track this in your watchlist or portfolio, or discover 53 more high quality undervalued stocks.
Approach 2: BrightView Holdings Price vs Sales
For a company like BrightView that is being evaluated on its revenue base, the P/S ratio is a useful way to see what investors are currently willing to pay for each dollar of sales. Unlike earnings based metrics, it is less affected by accounting choices and short term swings in profit, so it can be a cleaner way to compare businesses at different stages of profitability.
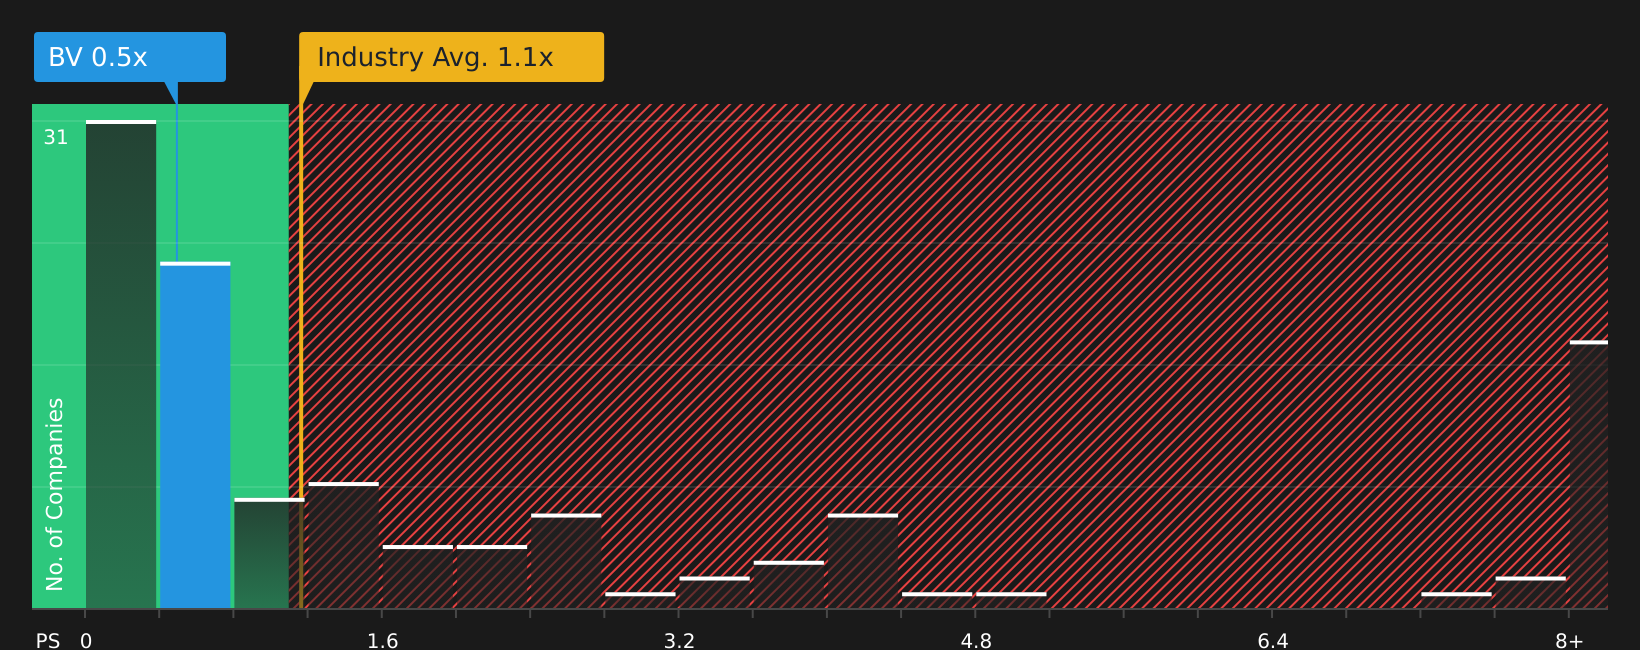
In general, higher growth expectations and lower perceived risk tend to support a higher P/S multiple, while slower expected growth or higher risk usually line up with a lower “normal” range. BrightView currently trades on a P/S of 0.47x, compared with the Commercial Services industry average of 1.33x and a peer group average of 2.30x, so the stock is priced below those simple benchmarks.
Simply Wall St’s Fair Ratio for BrightView is 0.67x, which is its view of what the P/S should be after considering factors such as earnings growth, profit margins, industry, market cap and company specific risks. Because this Fair Ratio is tailored to BrightView, it can be more informative than broad industry or peer comparisons that do not adjust for these characteristics. Set against the current 0.47x P/S, the Fair Ratio points to the shares trading below that fair range.
Result: UNDERVALUED
P/S ratios tell one story, but what if the real opportunity lies elsewhere? Start investing in legacies, not executives. Discover our 22 top founder-led companies.
Upgrade Your Decision Making: Choose your BrightView Holdings Narrative
Earlier we mentioned that there is an even better way to think about valuation, so let us introduce you to Narratives. These are simple stories you create about a company that sit behind the numbers such as your fair value, and your expectations for future revenue, earnings and margins.
A Narrative links what you believe about BrightView’s business, such as its role in commercial landscaping and exposure to property and infrastructure activity, to a financial forecast and then to a fair value that you can directly compare with today’s share price.
On Simply Wall St, Narratives live in the Community page, where millions of investors can set their own assumptions, see a fair value estimate update instantly, and then decide whether the current price suggests they should consider buying, holding, or selling.
Narratives update automatically when fresh information like earnings releases or news headlines is added. For BrightView you might see one investor using very optimistic revenue and margin assumptions that lead to a much higher fair value, while another uses more conservative inputs that produce a much lower figure.
Do you think there's more to the story for BrightView Holdings? Head over to our Community to see what others are saying!

This article by Simply Wall St is general in nature. We provide commentary based on historical data and analyst forecasts only using an unbiased methodology and our articles are not intended to be financial advice. It does not constitute a recommendation to buy or sell any stock, and does not take account of your objectives, or your financial situation. We aim to bring you long-term focused analysis driven by fundamental data. Note that our analysis may not factor in the latest price-sensitive company announcements or qualitative material. Simply Wall St has no position in any stocks mentioned.