Is Cadence Bank (CADE) Price Fair After Strong Multi‑Year Share Performance?
Cadence Bank CADE | 42.11 | 0.00% |
- If you are wondering whether Cadence Bank's current share price offers good value or not, you are in the right place because this article focuses squarely on what investors may be paying for today.
- Cadence Bank's stock has recently closed at US$45.67, with returns of 6.6% over 7 days, 9.7% over 30 days, 5.7% year to date, 34.3% over 1 year and 76.9% over 5 years. This raises questions about how much of this performance is already reflected in the price.
- Recent attention on Cadence Bank has centred on its position in the regional banking sector and how investors think about risk and profitability for these types of institutions. This context matters for valuation because sentiment toward regional banks can influence how much investors are willing to pay for each dollar of earnings, book value or cash flow.
- Cadence Bank currently has a valuation score of 2 out of 6, which means it screens as undervalued on 2 of the 6 checks we use. Next we will walk through the common valuation methods before finishing with a more complete way of thinking about what the stock might be worth.
Cadence Bank scores just 2/6 on our valuation checks. See what other red flags we found in the full valuation breakdown.
Approach 1: Cadence Bank Excess Returns Analysis
The Excess Returns model looks at how much profit Cadence Bank is expected to generate above the return that shareholders require, based on the bank’s equity base. Instead of focusing on cash flows, it asks whether each dollar of book value is working hard enough to justify the share price.
For Cadence Bank, the model uses a Book Value of US$31.75 per share and a Stable EPS of US$3.83 per share, based on weighted future Return on Equity estimates from 9 analysts. The implied Cost of Equity is US$2.51 per share, which leaves an Excess Return of US$1.32 per share. That sits alongside an Average Return on Equity of 10.62% and a Stable Book Value estimate of US$36.05 per share, sourced from 8 analysts.
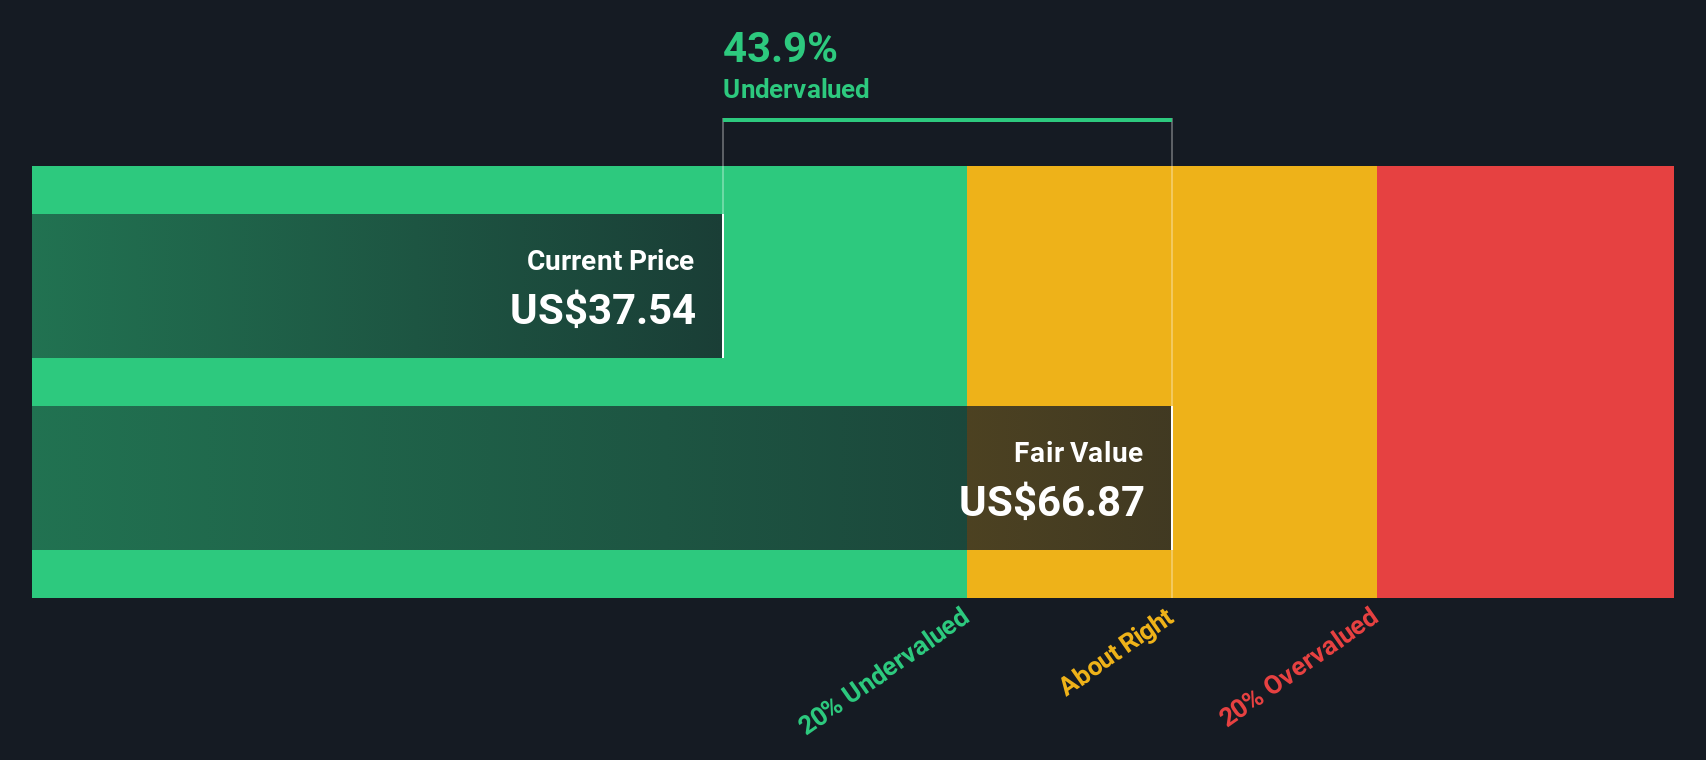
These inputs are combined in the Excess Returns framework to arrive at an estimated intrinsic value of US$71.81 per share. Compared with the recent share price of US$45.67, this implies the stock screens as undervalued by about 36.4% on this model.
Result: UNDERVALUED
Our Excess Returns analysis suggests Cadence Bank is undervalued by 36.4%. Track this in your watchlist or portfolio, or discover 881 more undervalued stocks based on cash flows.
Approach 2: Cadence Bank Price vs Earnings
For a profitable bank like Cadence Bank, the P/E ratio is a useful yardstick because it tells you how many dollars you are paying for each dollar of current earnings. It is a quick way to line up price against the earnings power that already exists today.
In practice, investors tend to accept a higher or lower “normal” P/E depending on what they expect for future growth and how risky they think those earnings are. Higher expected growth or lower perceived risk can support a higher P/E, while slower expected growth or higher risk usually points to a lower one.
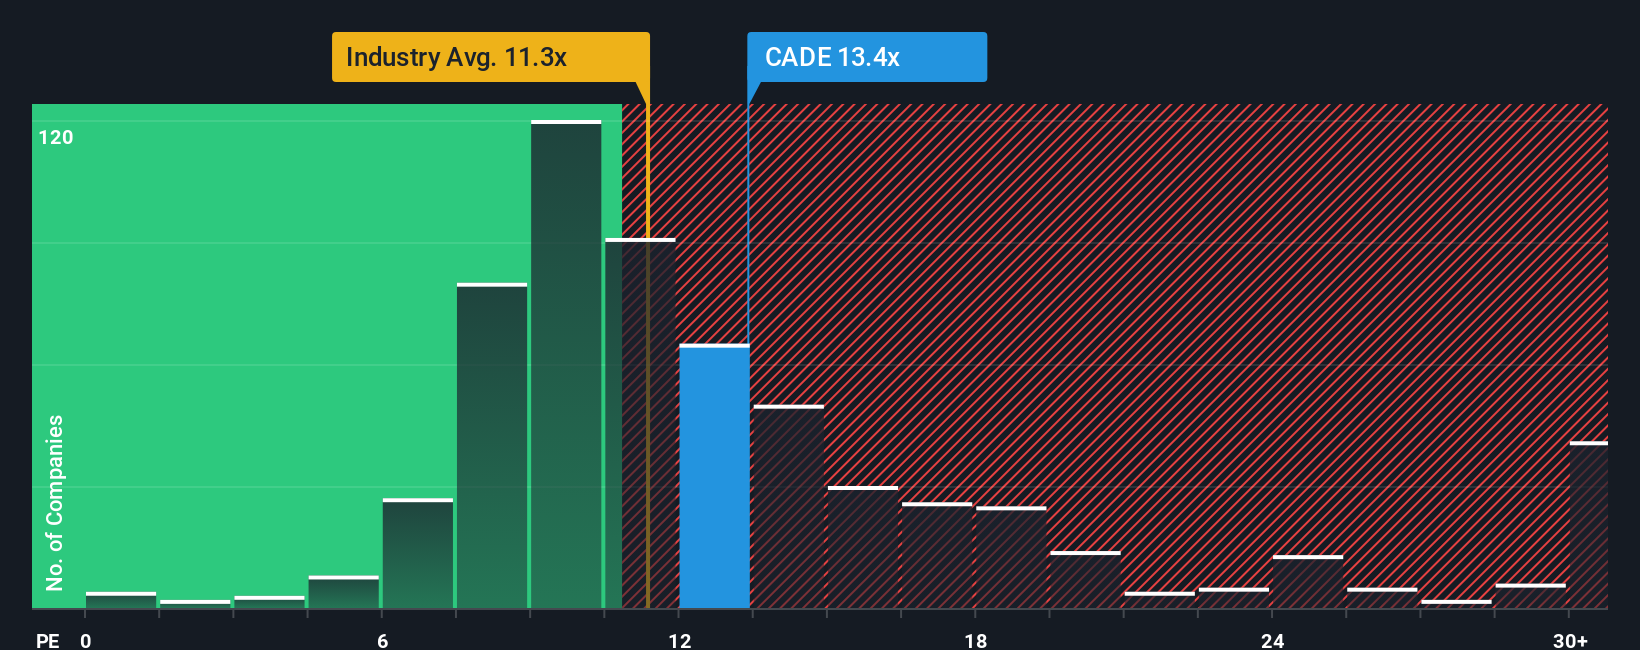
Cadence Bank currently trades on a P/E of 16.41x. That sits above the Banks industry average of 11.87x and above the peer group average of 12.71x, which on simple comparisons could look expensive. Simply Wall St’s Fair Ratio for Cadence Bank is 14.89x, which is a proprietary estimate of what the P/E might be given factors such as its earnings profile, industry, profit margins, market value and assessed risks. This Fair Ratio can be more informative than raw peer or industry comparisons because it adjusts for those company specific traits. Set against the current 16.41x, the Fair Ratio suggests Cadence Bank’s shares screen as overvalued on this metric.
Result: OVERVALUED
P/E ratios tell one story, but what if the real opportunity lies elsewhere? Discover 1445 companies where insiders are betting big on explosive growth.
Upgrade Your Decision Making: Choose your Cadence Bank Narrative
Earlier we mentioned that there is an even better way to understand valuation. On Simply Wall St’s Community page you can use Narratives to turn your view of Cadence Bank into a simple story that links your assumptions about future revenue, earnings and margins to a financial forecast, a fair value and then a clear comparison with today’s share price. Each Narrative updates automatically when fresh news or earnings arrive and allows different investors to disagree constructively. For example, one Cadence Narrative might lean on a fair value near US$42.70 with assumptions around earnings of US$810.9 million, EPS of US$4.22 and a future P/E of about 12.81x, while another might anchor closer to the lower analyst target of US$40.20. This allows you to quickly see which story you believe and whether the current price looks high or low against that lens.
Do you think there's more to the story for Cadence Bank? Head over to our Community to see what others are saying!

This article by Simply Wall St is general in nature. We provide commentary based on historical data and analyst forecasts only using an unbiased methodology and our articles are not intended to be financial advice. It does not constitute a recommendation to buy or sell any stock, and does not take account of your objectives, or your financial situation. We aim to bring you long-term focused analysis driven by fundamental data. Note that our analysis may not factor in the latest price-sensitive company announcements or qualitative material. Simply Wall St has no position in any stocks mentioned.