Is Cadence Design Systems (CDNS) Pricing Still Justified After Recent Share Pullback
Cadence Design Systems, Inc. CDNS | 278.72 | -0.52% |
- If you are looking at Cadence Design Systems and wondering whether the current price still makes sense, this article walks through what that share price could imply about value.
- The stock last closed at US$301.84, with a 1% decline over the past week, a 6.3% decline over the past month, and a 2.8% decline year to date, while the 1 year, 3 year and 5 year returns sit at 18.9%, 57.7% and 125.7% respectively.
- This article was prompted to provide ongoing coverage of Cadence Design Systems, so we will be looking at how the current share price lines up with its fundamentals and market expectations. Rather than reacting to a single event, the goal is to give you context that still makes sense even as new headlines arrive.
- Right now, Cadence Design Systems has a valuation score of 1 out of 6, which means it screens as undervalued on only one of six checks. Next we will walk through the usual valuation tools such as multiples and discounted cash flow, then finish with a way of thinking about value that can help tie all these methods together.
Cadence Design Systems scores just 1/6 on our valuation checks. See what other red flags we found in the full valuation breakdown.
Approach 1: Cadence Design Systems Discounted Cash Flow (DCF) Analysis
A Discounted Cash Flow, or DCF, model estimates what a company could be worth by projecting its future cash flows and discounting them back to today, so you can compare that value with the current share price.
For Cadence Design Systems, the model used is a 2 Stage Free Cash Flow to Equity approach, based on cash flow projections. The latest twelve month free cash flow is about US$1.59b. Analyst estimates are available out to 2028, with projected free cash flow of about US$2.54b in that year. Simply Wall St then extends those projections further using its own assumptions for 2029 to 2035.
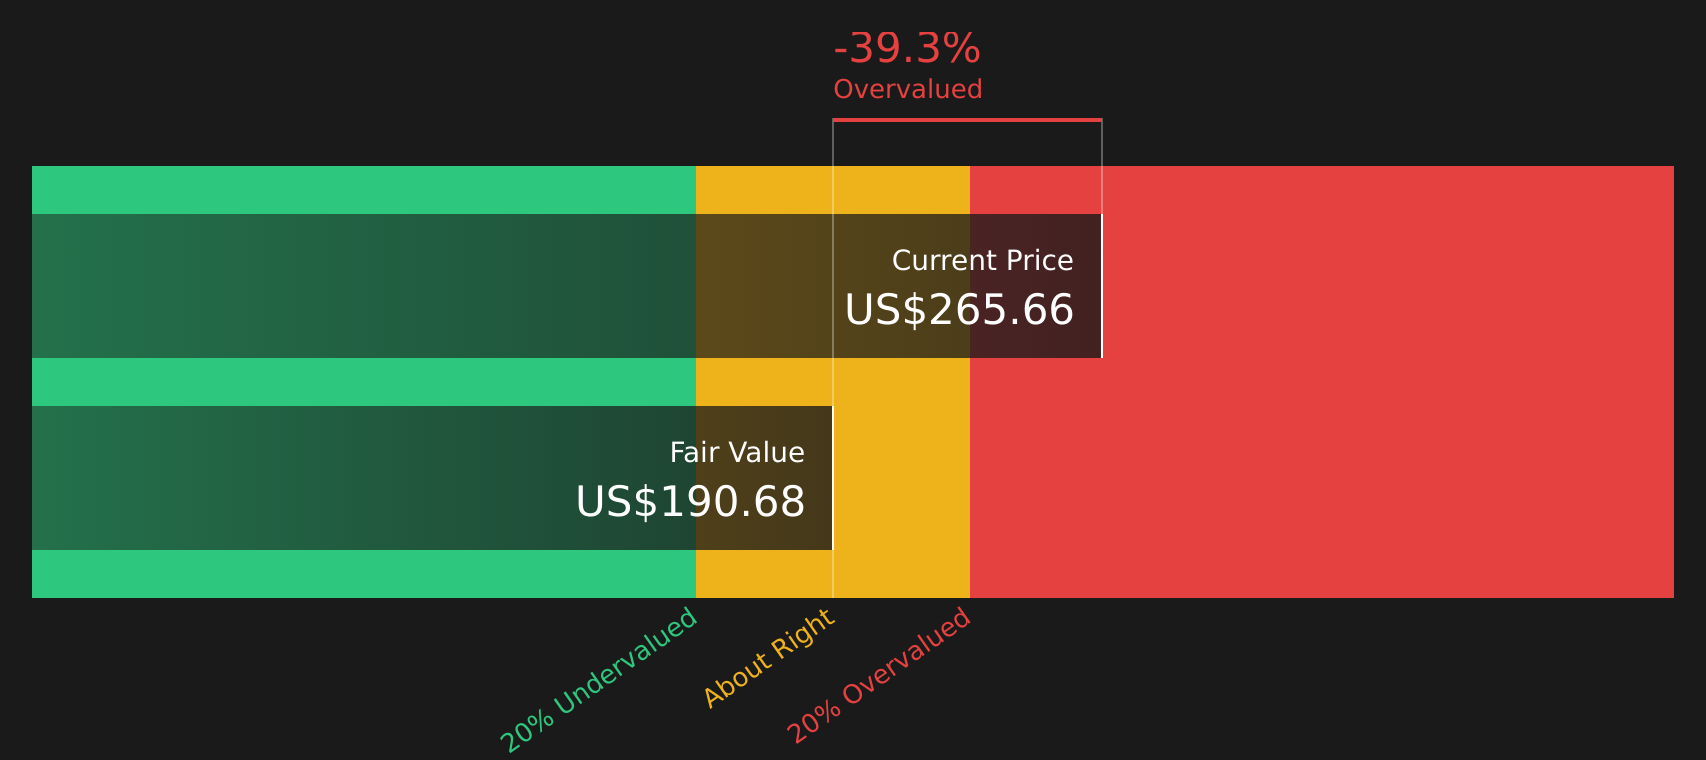
After discounting these projected cash flows back to today, the DCF model arrives at an estimated intrinsic value of about US$191.50 per share. Compared with the recent share price of US$301.84, this implies the stock screens as around 57.6% overvalued based on this method alone.
Result: OVERVALUED
Our Discounted Cash Flow (DCF) analysis suggests Cadence Design Systems may be overvalued by 57.6%. Discover 53 high quality undervalued stocks or create your own screener to find better value opportunities.
Approach 2: Cadence Design Systems Price vs Earnings
For profitable companies, the P/E ratio is a helpful way to think about value because it directly links what you pay for each share with the earnings that company is generating today.
What counts as a normal or fair P/E usually reflects how the market sees a company’s growth potential and risk. Higher expected growth or lower perceived risk can support a higher P/E, while slower growth or higher uncertainty often lines up with a lower P/E.
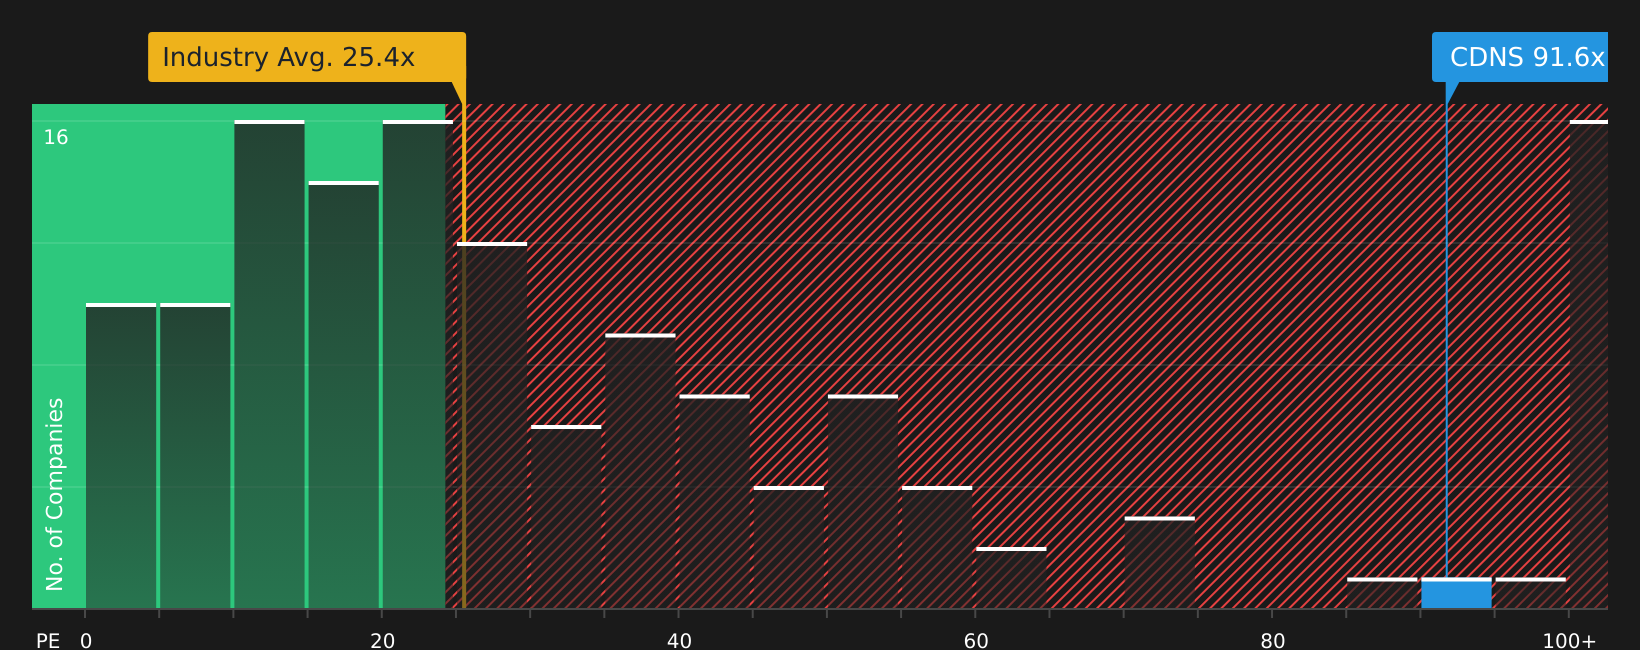
Cadence Design Systems is currently trading on a P/E of about 75.1x. That sits well above the Software industry average of around 25.8x, and also above the peer average of roughly 37.0x. Simply Wall St’s Fair Ratio for Cadence Design Systems is 37.8x, which is its view of what a more appropriate P/E might be once factors like earnings growth, industry, profit margins, market cap and risk are taken into account.
This Fair Ratio aims to be more tailored than a simple peer or industry comparison because it adjusts for those company specific features rather than assuming all software stocks deserve the same multiple. Compared with the current P/E of 75.1x, the Fair Ratio of 37.8x suggests the shares screen as expensive on this metric.
Result: OVERVALUED
P/E ratios tell one story, but what if the real opportunity lies elsewhere? Start investing in legacies, not executives. Discover our 21 top founder-led companies.
Upgrade Your Decision Making: Choose your Cadence Design Systems Narrative
Earlier we mentioned that there is an even better way to understand valuation. Narratives let you connect your view of Cadence Design Systems to numbers by turning your story about its future revenue, earnings and margins into a forecast, linking that forecast to a Fair Value, and then comparing that Fair Value with the current price so you can judge whether the stock looks attractive or stretched. This all happens inside an accessible tool on Simply Wall St’s Community page that updates automatically as new news or earnings arrive. One investor might publish a more bullish Cadence Design Systems Narrative with a Fair Value near US$418, while another might share a more cautious Narrative closer to US$318. You can see both side by side and decide which assumptions you find more reasonable.
Do you think there's more to the story for Cadence Design Systems? Head over to our Community to see what others are saying!

This article by Simply Wall St is general in nature. We provide commentary based on historical data and analyst forecasts only using an unbiased methodology and our articles are not intended to be financial advice. It does not constitute a recommendation to buy or sell any stock, and does not take account of your objectives, or your financial situation. We aim to bring you long-term focused analysis driven by fundamental data. Note that our analysis may not factor in the latest price-sensitive company announcements or qualitative material. Simply Wall St has no position in any stocks mentioned.