

Is CorVel (CRVL) Cheap Following Its Claims Management Award?
CorVel Corporation CRVL | 0.00 |
CorVel (CRVL) was recently named a 2026 PropertyCasualty360 Insurance Luminaries winner for Excellence in Claims Management, putting its integrated, technology driven claims model in focus for investors assessing the stock.
Despite the recent claims management award drawing fresh attention to CorVel, the stock’s recent momentum has been mixed. The 30 day share price return is 5.21% and the 90 day share price return is 16.36%, while the 1 year total shareholder return is down 36.92%.
If this kind of claims technology story interests you, it can be useful to compare CorVel with other companies using artificial intelligence in healthcare, starting with the 40 healthcare AI stocks
CorVel’s share price has rebounded in recent months yet remains well below its 1 year level, while one intrinsic estimate sits at a sizeable discount to the current US$63. Where might fair value realistically sit within that spread?
Price-to-Earnings of 29.1x: Is it justified?
On one side, the SWS DCF model suggests CorVel is trading at a sizeable discount to an estimated fair value of $96.78, compared with the last close at $63. On the other side, the stock changes hands at a P/E of 29.1x, which sets a clear benchmark for how the market is pricing its current earnings.
The P/E ratio compares CorVel’s share price with its earnings per share, so a 29.1x multiple effectively shows how many dollars investors are paying today for each dollar of earnings. For a healthcare claims and cost containment company using artificial intelligence and data heavy workflows, many investors watch this measure closely because it ties valuation directly to profit generation.
CorVel’s recent earnings growth of 16% over the past year and an average of 14.5% per year over five years, alongside an 11.5% net profit margin and high 28% return on equity, gives some context for why the stock might command a relatively full multiple. Those figures point to a business that has been growing profits and generating strong returns on shareholder capital, even though there is currently insufficient data to judge future growth expectations or compare them with the wider US market.
Compared with the broader US Healthcare industry P/E of 25x, CorVel’s 29.1x multiple looks expensive and implies the market is assigning a premium to its earnings. Yet against a peer set where the average P/E sits at 99.4x, CorVel screens as good value, which suggests its current pricing is conservative relative to that tighter comparison group while still richer than the wider industry.
Result: Price-to-Earnings of 29.1x (ABOUT RIGHT)
However, CorVel’s narrative could be tested if its recent 1 year total shareholder return, which is down 36.92%, reflects deeper issues in core claims operations.
Another View: What CorVel’s DCF Implies
While CorVel’s 29.1x P/E suggests the stock is priced roughly in line with its earnings strength, the SWS DCF model points in a different direction. With fair value estimated at $96.78 versus a $63 share price, that gap frames a possible upside that the multiple alone does not capture.
This kind of split between earnings multiples and discounted cash flow can signal either opportunity or a mismatch between market expectations and long term cash generation. The key question is whether CorVel’s cash flows will track closer to what the DCF implies or what today’s P/E is signaling.
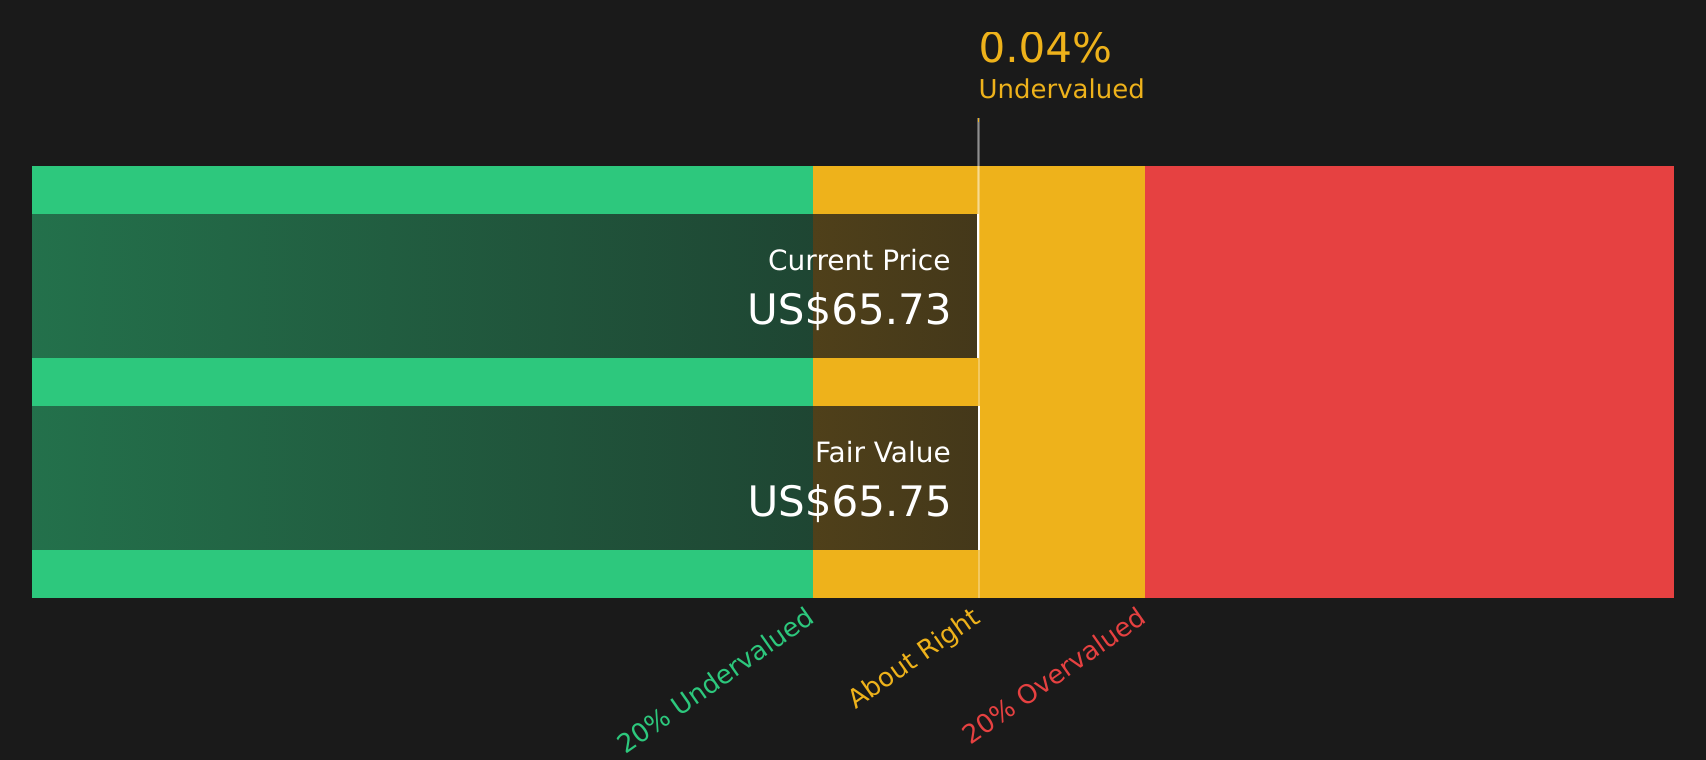
Simply Wall St performs a discounted cash flow (DCF) on every stock in the world every day (check out CorVel for example). We show the entire calculation in full. You can track the result in your watchlist or portfolio and be alerted when this changes, or use our stock screener to discover 44 high quality undervalued stocks. If you save a screener we even alert you when new companies match - so you never miss a potential opportunity.
Next Steps
With CorVel’s story showing both pressure on recent shareholder returns and potential upside in the valuation models, this is a moment to look closely at the numbers yourself and decide how you feel about the balance of risks and rewards, starting with the 2 key rewards and 1 important warning sign.
Looking for more investment ideas beyond CorVel?
If CorVel has sharpened your focus on quality, do not stop here. Use the Simply Wall St Screener to widen your watchlist with fresh, data backed ideas.
- Target steadier compounding by reviewing companies screened as 72 resilient stocks with low risk scores. This allows you to focus on businesses with lower risk scores instead of short term noise.
- Hunt for mispriced opportunities using the 44 high quality undervalued stocks, built to highlight stocks where quality fundamentals and price do not fully match up.
- Spot potential future standouts by scanning the screener containing 19 high quality undiscovered gems, a set of lesser known companies filtered for stronger underlying fundamentals.
This article by Simply Wall St is general in nature. We provide commentary based on historical data and analyst forecasts only using an unbiased methodology and our articles are not intended to be financial advice. It does not constitute a recommendation to buy or sell any stock, and does not take account of your objectives, or your financial situation. We aim to bring you long-term focused analysis driven by fundamental data. Note that our analysis may not factor in the latest price-sensitive company announcements or qualitative material. Simply Wall St has no position in any stocks mentioned.