Is Crane (CR) Starting To Look Fully Priced After Recent Share Price Volatility
Crane Company CR | 0.00 |
- If you are wondering whether Crane at around US$183 per share still offers value or is starting to look stretched, the next sections will help you frame that question clearly.
- The stock has been volatile recently, with a 5.1% decline over the last 7 days, an 11.4% gain over the past month, a 2.4% year to date decline, and a 23.7% return over the past year. These shifts can change how you think about both potential opportunity and risk.
- Recent news coverage has focused on Crane's positioning within the wider capital goods space and how investors are reacting to corporate updates and sector sentiment. This backdrop helps explain why the share price has seen both short term weakness and longer term strength over the returns periods mentioned.
- Crane currently has a valuation score of 2 out of 6, based on how many checks suggest the shares may be undervalued. The rest of this article will compare different valuation approaches, then finish with a framework that can help you put all of those methods into a clearer, big picture view.
Crane scores just 2/6 on our valuation checks. See what other red flags we found in the full valuation breakdown.
Approach 1: Crane Discounted Cash Flow (DCF) Analysis
A Discounted Cash Flow model takes projected future cash flows, then discounts them back to today to estimate what the entire stream could be worth in present terms. It is essentially asking what Crane’s future cash generation might be worth in today’s dollars.
Crane’s latest twelve month free cash flow is about $347.6 million. Using a 2 Stage Free Cash Flow to Equity model based on analyst estimates for the next few years, then extending those projections further out, Simply Wall St models free cash flow reaching $620.2 million in 2030. Beyond the analyst horizon, the later years, from 2031 to 2035, are extrapolated using gradually moderating growth assumptions rather than additional analyst forecasts.
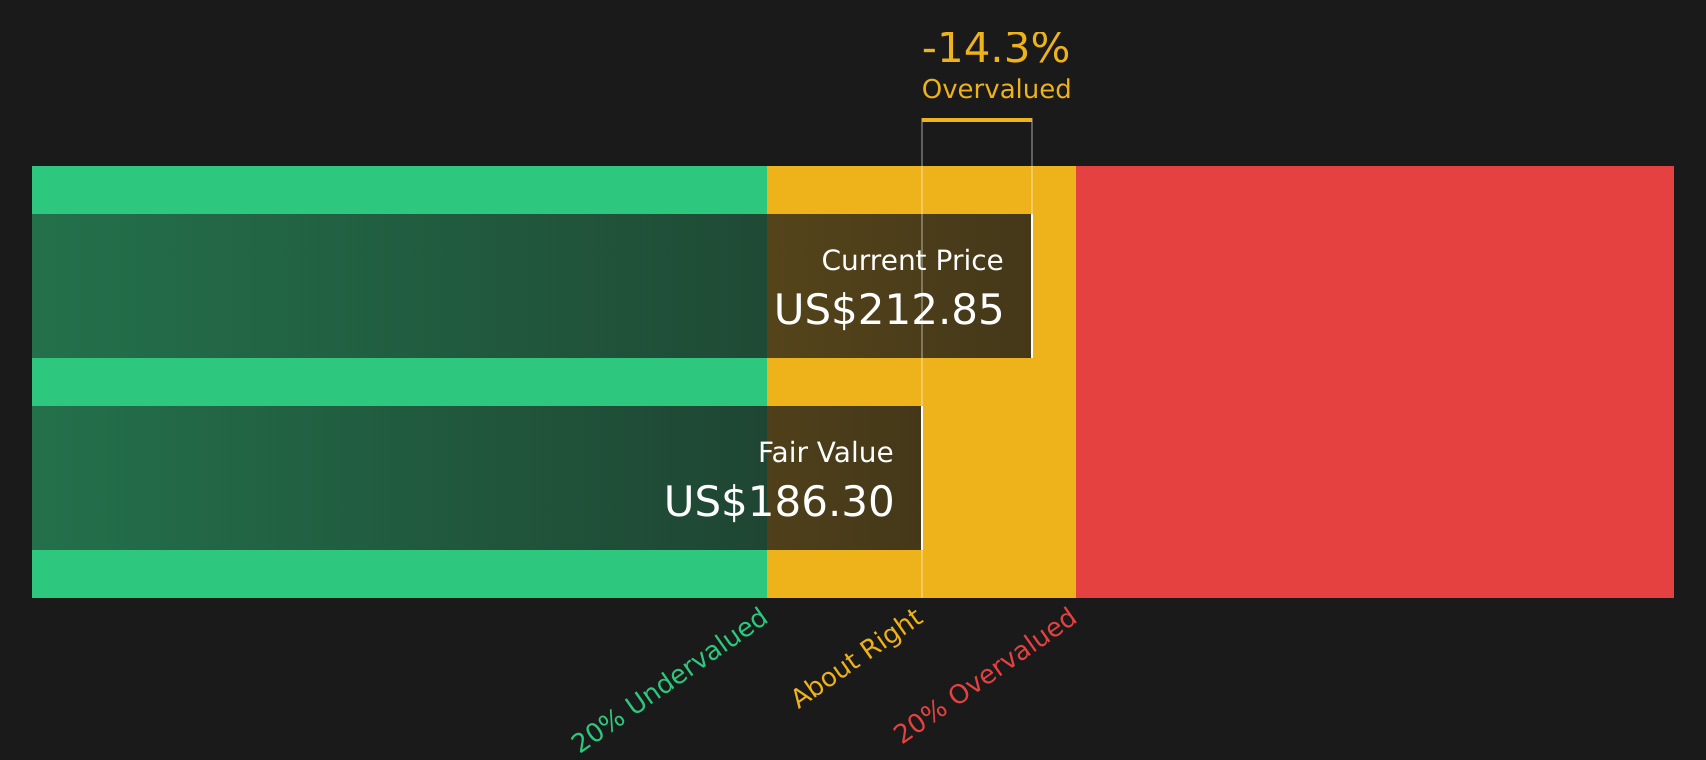
When all those projected cash flows are discounted back to today, the DCF model suggests an intrinsic value of about $188.05 per share. Compared with the recent share price of around $183, this implies Crane trades at roughly a 2.7% discount to that estimate, which is a fairly small gap.
Result: ABOUT RIGHT
Crane is fairly valued according to our Discounted Cash Flow (DCF), but this can change at a moment's notice. Track the value in your watchlist or portfolio and be alerted on when to act.
Approach 2: Crane Price vs Earnings
For profitable companies, the P/E ratio is a useful way to relate what you pay for each share to the earnings that share currently produces. It helps you see how many dollars investors are willing to pay today for one dollar of Crane’s annual earnings.
What counts as a “normal” P/E usually reflects two big factors: how quickly earnings are expected to grow and how uncertain or risky those earnings are. Higher growth or lower perceived risk can justify a higher P/E, while slower growth or higher risk often lines up with a lower P/E.
Crane currently trades on a P/E of 31.86x. That is close to the peer average of 32.36x and above the Machinery industry average of 28.09x. Simply Wall St’s Fair Ratio for Crane is 24.65x, which is its proprietary estimate of what a balanced P/E might look like given the company’s earnings profile, margins, industry, size and risk characteristics.
The Fair Ratio can be more informative than simple peer or industry comparisons because it adjusts for company specific traits instead of assuming all Machinery stocks should trade on the same multiple. With Crane’s actual P/E above the Fair Ratio, the shares screen as overvalued on this measure.
Result: OVERVALUED

P/E ratios tell one story, but what if the real opportunity lies elsewhere? Start investing in legacies, not executives. Discover our 18 top founder-led companies.
Upgrade Your Decision Making: Choose your Crane Narrative
Earlier it was mentioned that there is an even better way to understand valuation, so Narratives are introduced. These are simply the story you believe about a company like Crane, translated into concrete numbers for future revenue, earnings, margins and a fair value that can be compared with the current share price.
On Simply Wall St, Narratives sit on the Community page and provide a clear link between a company story, a forecast and a fair value, so you can see at a glance whether your view suggests the shares are attractively priced or expensive today.
Because Narratives update when new information appears, such as earnings guidance, dividend changes or leadership news, you always see a refreshed fair value based on the latest inputs rather than a static snapshot.
For Crane, one investor might align with a cautious Narrative that points to a fair value near US$182.0. Another might lean toward a more optimistic Narrative closer to US$238.0. Both can then compare their chosen fair value with the live price to decide whether they see a buy, hold or sell situation.
Do you think there's more to the story for Crane? Head over to our Community to see what others are saying!

This article by Simply Wall St is general in nature. We provide commentary based on historical data and analyst forecasts only using an unbiased methodology and our articles are not intended to be financial advice. It does not constitute a recommendation to buy or sell any stock, and does not take account of your objectives, or your financial situation. We aim to bring you long-term focused analysis driven by fundamental data. Note that our analysis may not factor in the latest price-sensitive company announcements or qualitative material. Simply Wall St has no position in any stocks mentioned.