Is Cushman & Wakefield (CWK) Attractive After Recent Florida Expansion And Mixed Valuation Signals?
CUSHMAN & WAKEFIELD PLC CWK | 0.00 |
- If you are wondering whether Cushman & Wakefield is priced attractively at today’s levels, starting with a clear view of valuation can help you frame that question with more confidence.
- The stock last closed at US$12.13, with returns of 2.0% over 7 days, a 1.6% decline over 30 days, a 23.4% decline year to date, a 14.8% gain over 1 year, a 24.2% gain over 3 years and a 25.6% decline over 5 years, so the experience for shareholders has been very mixed across different time frames.
- Recent news around Cushman & Wakefield has focused on how the company is positioned within real estate services and how investors are weighing that positioning against broader sector sentiment. This backdrop helps explain why the share price has seen both periods of strength and periods of weakness as different pieces of information have come through.
- Cushman & Wakefield currently has a valuation score of 3 out of 6. The next step is to look at how different valuation approaches, and an even more comprehensive way of thinking about value at the end of this article, line up with that score.
Approach 1: Cushman & Wakefield Discounted Cash Flow (DCF) Analysis
A Discounted Cash Flow, or DCF, model takes projected future cash flows and discounts them back to today to estimate what the business might be worth right now.
For Cushman & Wakefield, the latest twelve month Free Cash Flow is about $291.3 million. The DCF model here uses a 2 Stage Free Cash Flow to Equity approach, starting with analyst inputs for the next few years and then extending those projections further out. By 2030, the model uses a projected Free Cash Flow of $456 million, with years in between based on a mix of analyst estimates and extrapolations provided by Simply Wall St.
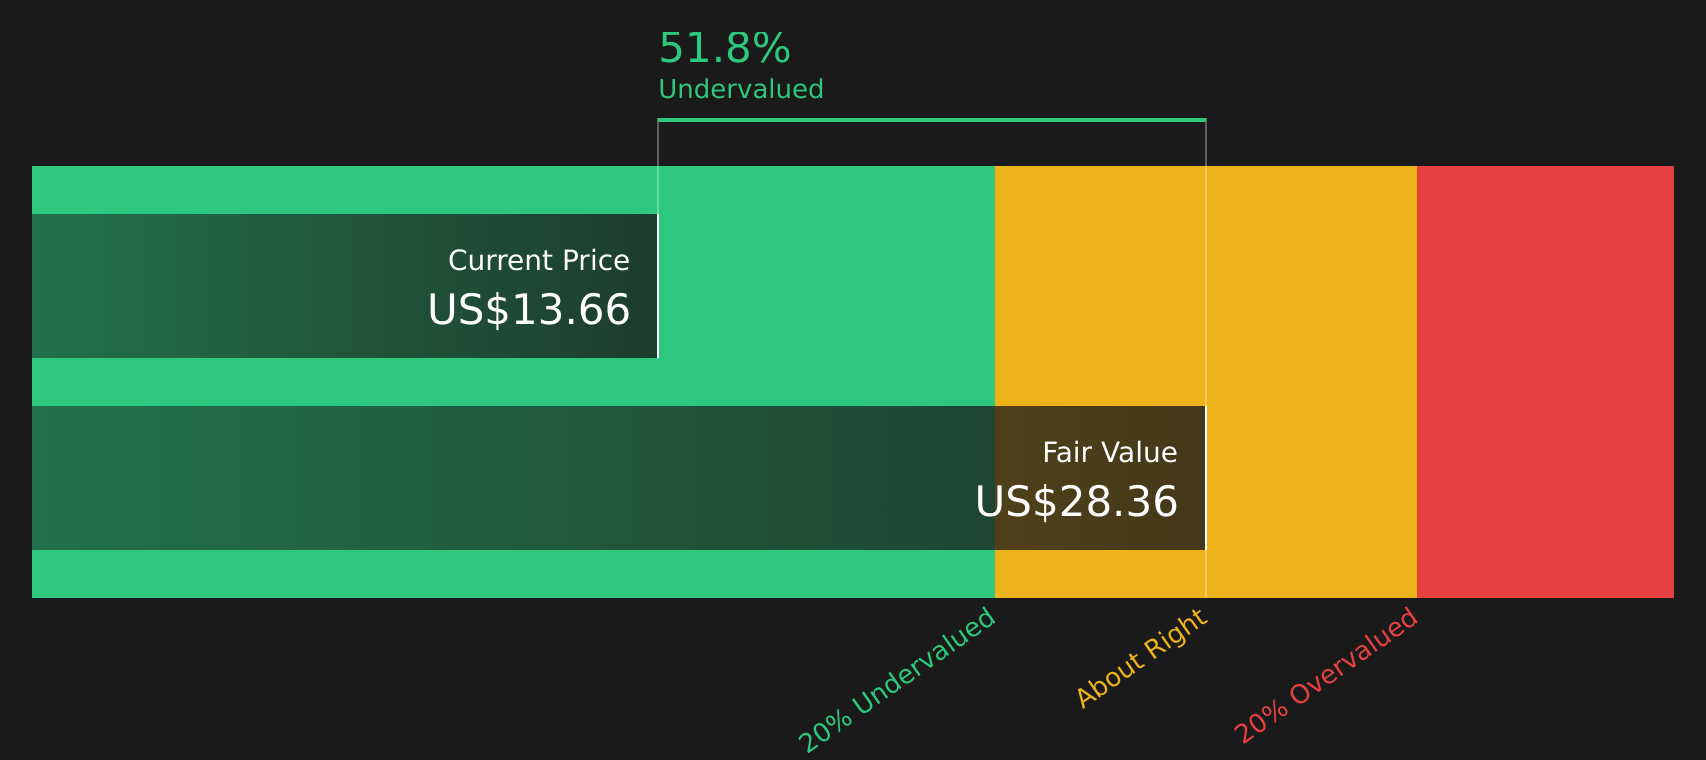
When all those future cash flows are discounted back, the model arrives at an estimated intrinsic value of about US$21.08 per share. Compared with the recent share price of US$12.13, this implies the stock is about 42.5% undervalued according to this DCF framework.
Result: UNDERVALUED
Our Discounted Cash Flow (DCF) analysis suggests Cushman & Wakefield is undervalued by 42.5%. Track this in your watchlist or portfolio, or discover 49 more high quality undervalued stocks.
Approach 2: Cushman & Wakefield Price vs Earnings
For profitable companies, the P/E ratio is a useful way to gauge how much investors are paying for each dollar of earnings. This makes it a straightforward anchor when you are comparing valuation across similar businesses.
A higher or lower P/E often reflects what the market is baking in for future growth and risk. Stronger earnings growth or more predictable cash flows can support a higher P/E, while more uncertain earnings or business risks tend to justify a lower P/E.
Cushman & Wakefield currently trades on a P/E of 31.88x. That sits above both the Real Estate industry average P/E of 21.34x and the peer group average of 24.42x, so the market is currently assigning a higher earnings multiple than these broad benchmarks.
Simply Wall St also provides a proprietary “Fair Ratio” of 23.71x for Cushman & Wakefield. This figure aims to reflect the P/E you might expect given factors such as the company’s earnings growth profile, industry, profit margins, market cap and key risks. Because it incorporates these company specific inputs, it can be more tailored than a simple comparison with peers or the wider industry.
Comparing the current P/E of 31.88x with the Fair Ratio of 23.71x suggests the shares are trading above that Fair Ratio estimate.
Result: OVERVALUED

P/E ratios tell one story, but what if the real opportunity lies elsewhere? Start investing in legacies, not executives. Discover our 20 top founder-led companies.
Upgrade Your Decision Making: Choose your Cushman & Wakefield Narrative
Earlier it was mentioned that there is an even better way to understand valuation, so Narratives are introduced here as a simple way for you to attach a clear story to your numbers, linking your view on Cushman & Wakefield’s future revenue, earnings and margins to a financial forecast and then to a Fair Value that you can compare with today’s price.
On Simply Wall St’s Community page, Narratives are set up as easy to use templates where you choose assumptions, see the Fair Value that is calculated, and then decide whether the gap between Fair Value and the current share price suggests the stock is closer to a buy, a hold or a sell for you.
Because Narratives refresh when new information arrives, such as Cushman & Wakefield’s Florida expansion and AI Impact Barometer launch or updates to analyst earnings expectations, your story and Fair Value move with the data instead of staying static.
For Cushman & Wakefield, one investor might align with the more optimistic community view that points to a Fair Value around US$21.69, while another might lean toward the more cautious Narrative closer to US$14.70. Comparing those with the consensus Fair Value of about US$18.38 helps you see where your own expectations sit on that spectrum.
Do you think there's more to the story for Cushman & Wakefield? Head over to our Community to see what others are saying!

This article by Simply Wall St is general in nature. We provide commentary based on historical data and analyst forecasts only using an unbiased methodology and our articles are not intended to be financial advice. It does not constitute a recommendation to buy or sell any stock, and does not take account of your objectives, or your financial situation. We aim to bring you long-term focused analysis driven by fundamental data. Note that our analysis may not factor in the latest price-sensitive company announcements or qualitative material. Simply Wall St has no position in any stocks mentioned.