Is DNOW (DNOW) Attractive After A 20% Monthly Gain And DCF Upside Potential
DNOW Inc. DNOW | 12.90 | +1.49% |
- If you are wondering whether DNOW is attractively priced or not, a useful starting point is to understand how the current share price compares with what the business may be worth.
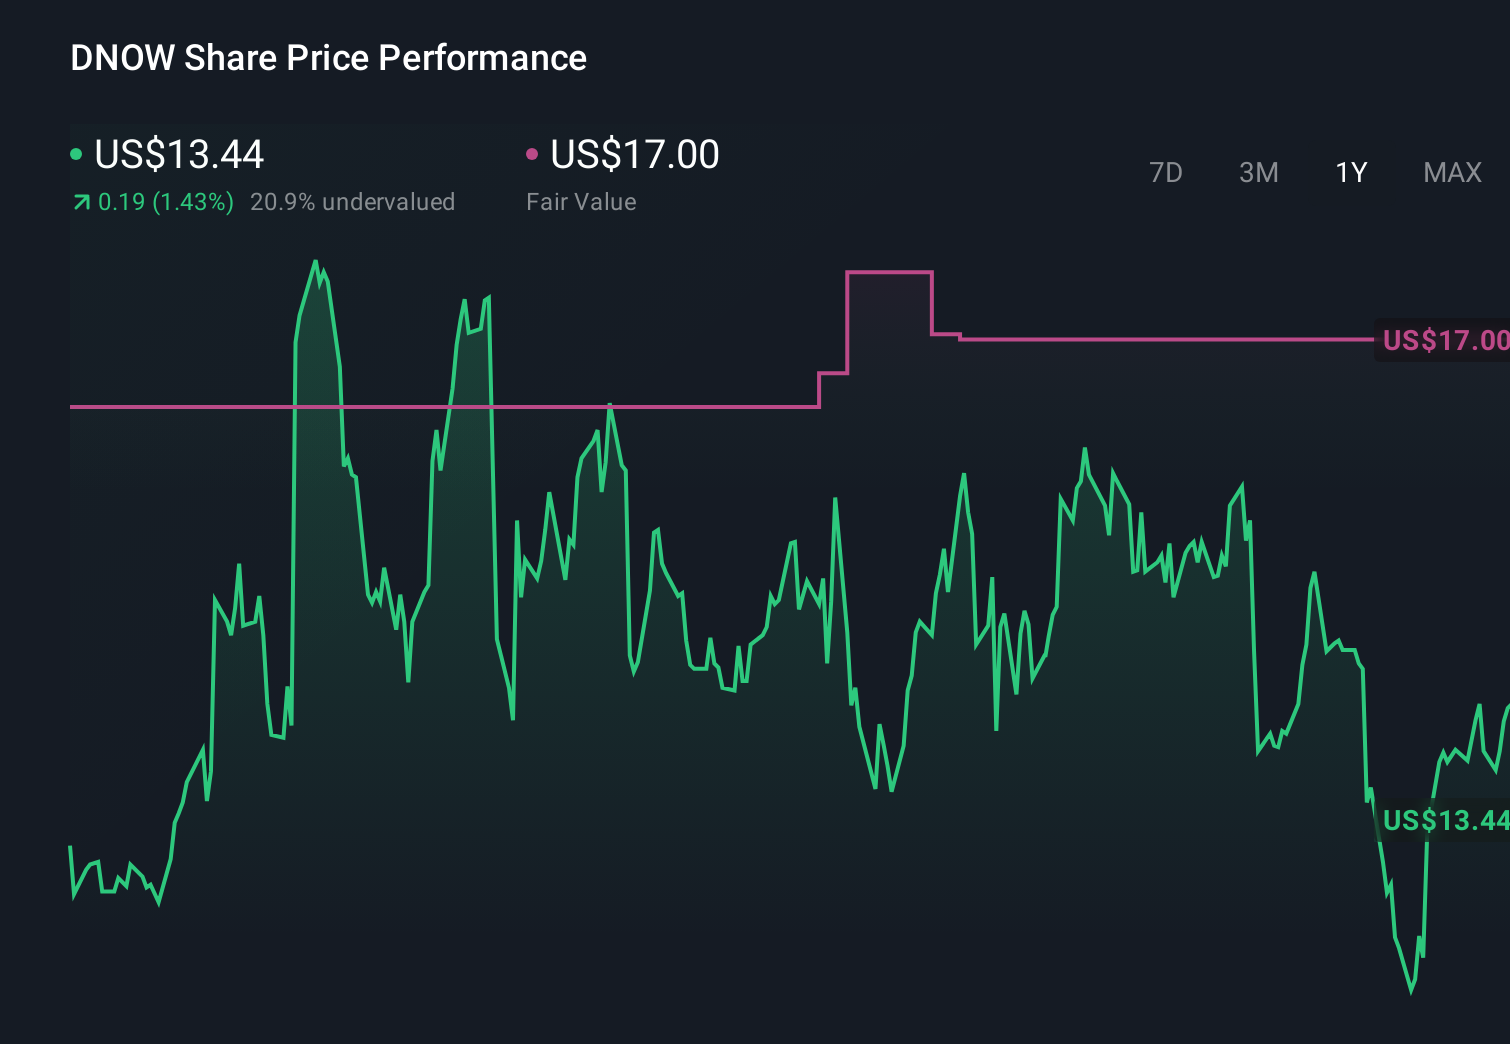
- DNOW recently closed at US$16.16, with a 30 day return of 20.3%, a 7 day return reflecting a 0.7% decline, and a 1 year return reflecting a 4.8% decline. These figures may influence how some investors view its potential and risk.
- Recent news coverage has focused on DNOW's position within the capital goods sector and on how investors are reacting to shifts in demand and company specific updates. This context helps explain why the stock has experienced a mix of shorter term gains and longer term weakness.
- Based on our checks, DNOW has a valuation score of 2 out of 6. We will look at what different valuation methods suggest about the stock and then consider a broader way to think about value that goes beyond any single model.
DNOW scores just 2/6 on our valuation checks. See what other red flags we found in the full valuation breakdown.
Approach 1: DNOW Discounted Cash Flow (DCF) Analysis
A Discounted Cash Flow, or DCF, estimates what a company might be worth by projecting its future cash flows and then discounting those back to today using a required rate of return.
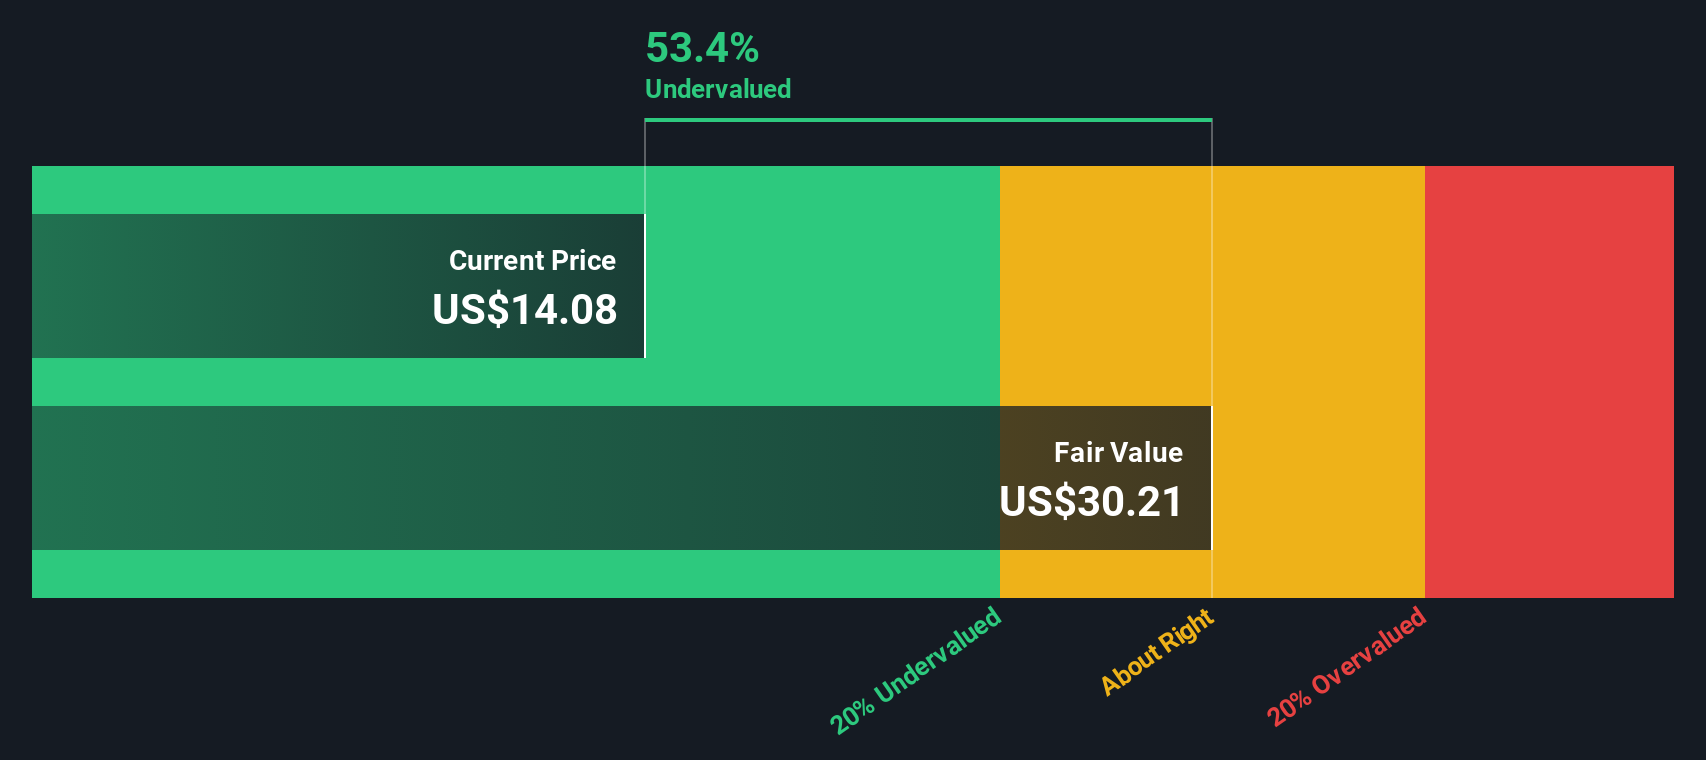
For DNOW, the model used is a 2 Stage Free Cash Flow to Equity approach based on cash flow projections. The latest twelve month free cash flow is about $179.6 million. Analyst inputs and extrapolated estimates suggest free cash flow rising to around $320.7 million in 2029, with further projections out to 2035 provided by Simply Wall St as part of the model rather than by analysts.
Bringing all those projected cash flows back to today gives an estimated intrinsic value of about $35.13 per share. Against the recent share price of US$16.16, the model output implies DNOW trades at roughly a 54.0% discount, which suggests the shares may be undervalued on this cash flow view.
Result: UNDERVALUED
Our Discounted Cash Flow (DCF) analysis suggests DNOW is undervalued by 54.0%. Track this in your watchlist or portfolio, or discover 55 more high quality undervalued stocks.
Approach 2: DNOW Price vs Earnings (P/E)
For a profitable company, the P/E ratio is a straightforward way to see how much investors are paying for each dollar of earnings. This makes it a useful cross check alongside a DCF model.
What counts as a “fair” P/E depends on what the market expects for growth and how risky those earnings appear to be. Higher expected growth or lower perceived risk can justify a higher P/E, while slower growth or higher risk usually point to a lower one.
DNOW currently trades on a P/E of 32.26x. That is above the Trade Distributors industry average P/E of 23.96x and also above the peer group average of 20.57x. Simply Wall St’s Fair Ratio for DNOW is 31.94x, which is its proprietary estimate of an appropriate P/E given factors such as the company’s earnings growth profile, industry, profit margins, market cap and risk characteristics.
The Fair Ratio is more tailored than a simple comparison with peers or the broad industry because it adjusts for DNOW’s specific fundamentals rather than assuming it should trade at the same multiple as the group. Comparing the current P/E of 32.26x with the Fair Ratio of 31.94x suggests the shares are priced about in line with this metric.
Result: ABOUT RIGHT

P/E ratios tell one story, but what if the real opportunity lies elsewhere? Start investing in legacies, not executives. Discover our 23 top founder-led companies.
Upgrade Your Decision Making: Choose your DNOW Narrative
Earlier we mentioned that there is an even better way to understand valuation, so let us introduce you to Narratives, which are simply your story about DNOW linked directly to your own forecasts for revenue, earnings and margins, and then to a fair value you can compare with the current price.
On Simply Wall St’s Community page, millions of investors can set up a Narrative by spelling out what they think is driving DNOW, plugging in their assumptions, and seeing how that story translates into a fair value that updates automatically when new information such as earnings or news arrives.
For example, one DNOW Narrative might focus on expansion into midstream markets, energy evolution sales, digital initiatives and international growth, and arrive at a fair value around US$17. Another could focus more on shrinking margins, competition and weaker activity in some markets, and land on a lower fair value. By comparing each Narrative’s fair value to the share price you can decide whether the stock looks attractive, fully priced or expensive based on the story you find most credible.
Do you think there's more to the story for DNOW? Head over to our Community to see what others are saying!
This article by Simply Wall St is general in nature. We provide commentary based on historical data and analyst forecasts only using an unbiased methodology and our articles are not intended to be financial advice. It does not constitute a recommendation to buy or sell any stock, and does not take account of your objectives, or your financial situation. We aim to bring you long-term focused analysis driven by fundamental data. Note that our analysis may not factor in the latest price-sensitive company announcements or qualitative material. Simply Wall St has no position in any stocks mentioned.