Is Driven Brands Holdings (DRVN) Pricing Look Interesting After Recent Share Price Weakness
Driven Brands Holdings, Inc. DRVN | 12.34 | +0.08% |
- If you are wondering whether Driven Brands Holdings is attractively priced at its current level, this article walks through the numbers so you can judge the value story for yourself.
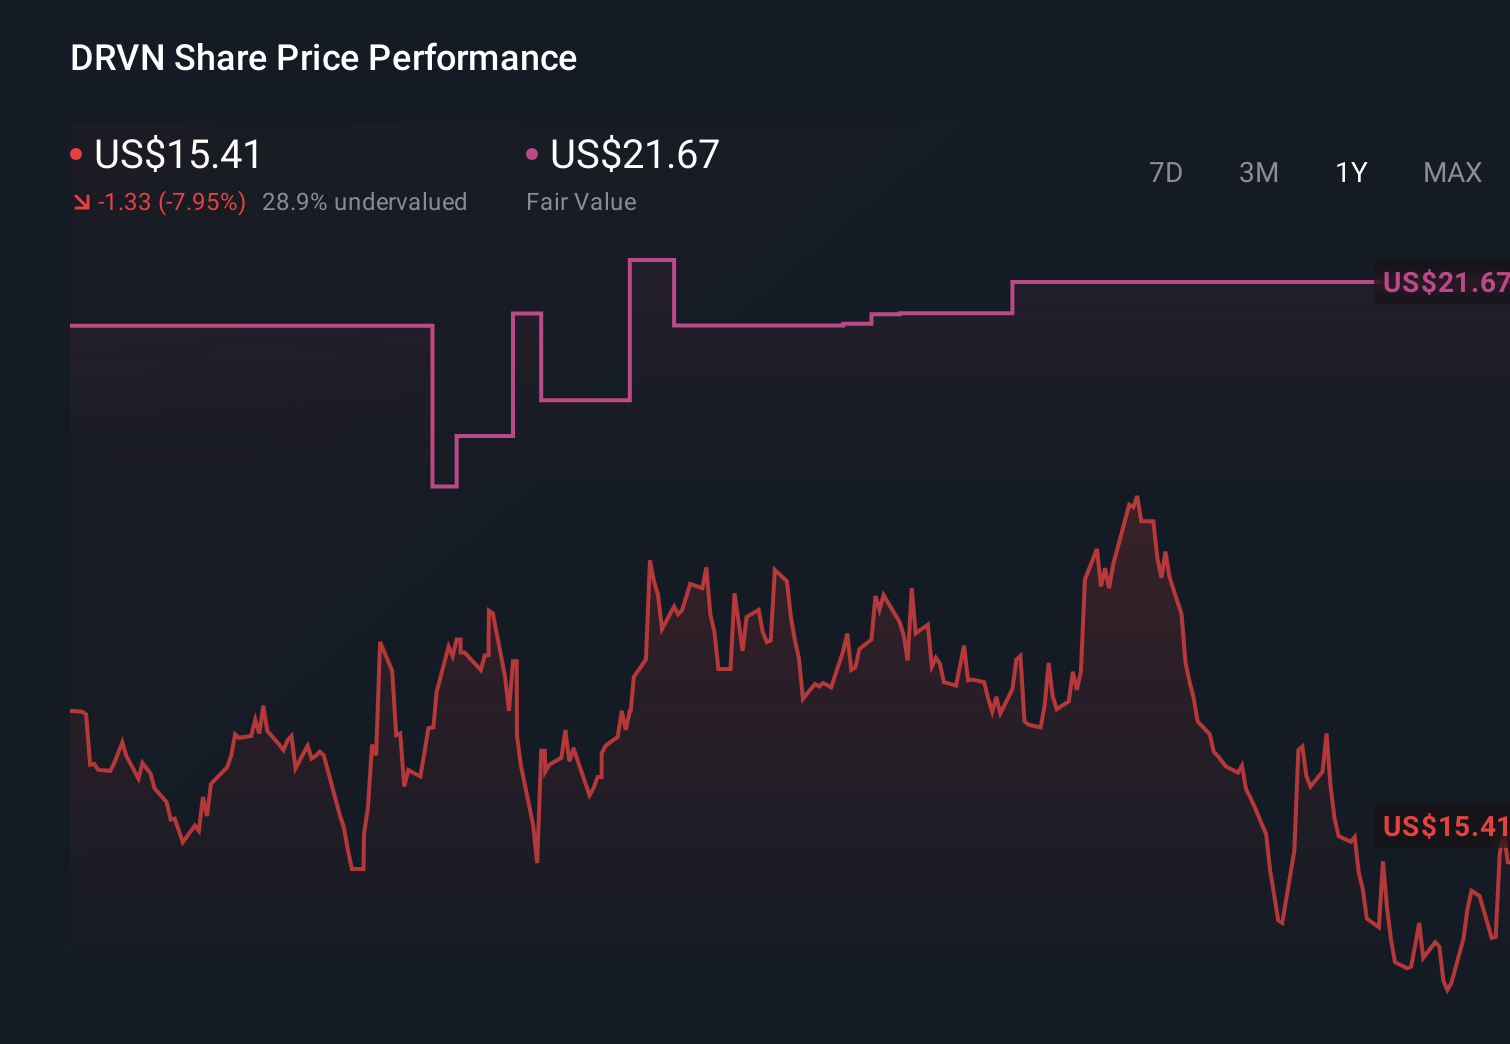
- The share price closed at US$15.52 most recently, with returns of 1.1% over the last 30 days, 7.0% year to date, and a 2.4% decline over the past year, alongside deeper 3 year and 5 year declines of 43.3% and 47.9%.
- Recent moves in the stock have drawn attention back to how the company is positioned in auto services and franchised brands, and what investors may be pricing in around its long term prospects. Broader sector sentiment, corporate updates outside of earnings, and changing expectations around consumer services have all helped frame how the current share price is being viewed.
- On Simply Wall St's 6 point valuation framework, Driven Brands scores 5 out of 6. In the remainder of this article we look at what different valuation methods suggest about the stock's price today, then finish with a way to tie those models together into a clearer view of value.
Approach 1: Driven Brands Holdings Discounted Cash Flow (DCF) Analysis
A Discounted Cash Flow, or DCF, model estimates what a company might be worth by projecting its future cash flows and then discounting those back into today’s dollars.
For Driven Brands Holdings, the model used is a 2 Stage Free Cash Flow to Equity approach, based on cash flows in $. The latest twelve month free cash flow is a loss of $168.2 million, so the valuation leans heavily on what the business could generate in the future rather than on recent cash generation.
Analysts provide explicit free cash flow estimates up to 2027, where free cash flow is projected at $293.5 million. Beyond that, Simply Wall St extrapolates out to 2035, with projected free cash flows rising into the mid hundreds of millions, and then discounts each of those figures back to today using its DCF framework.
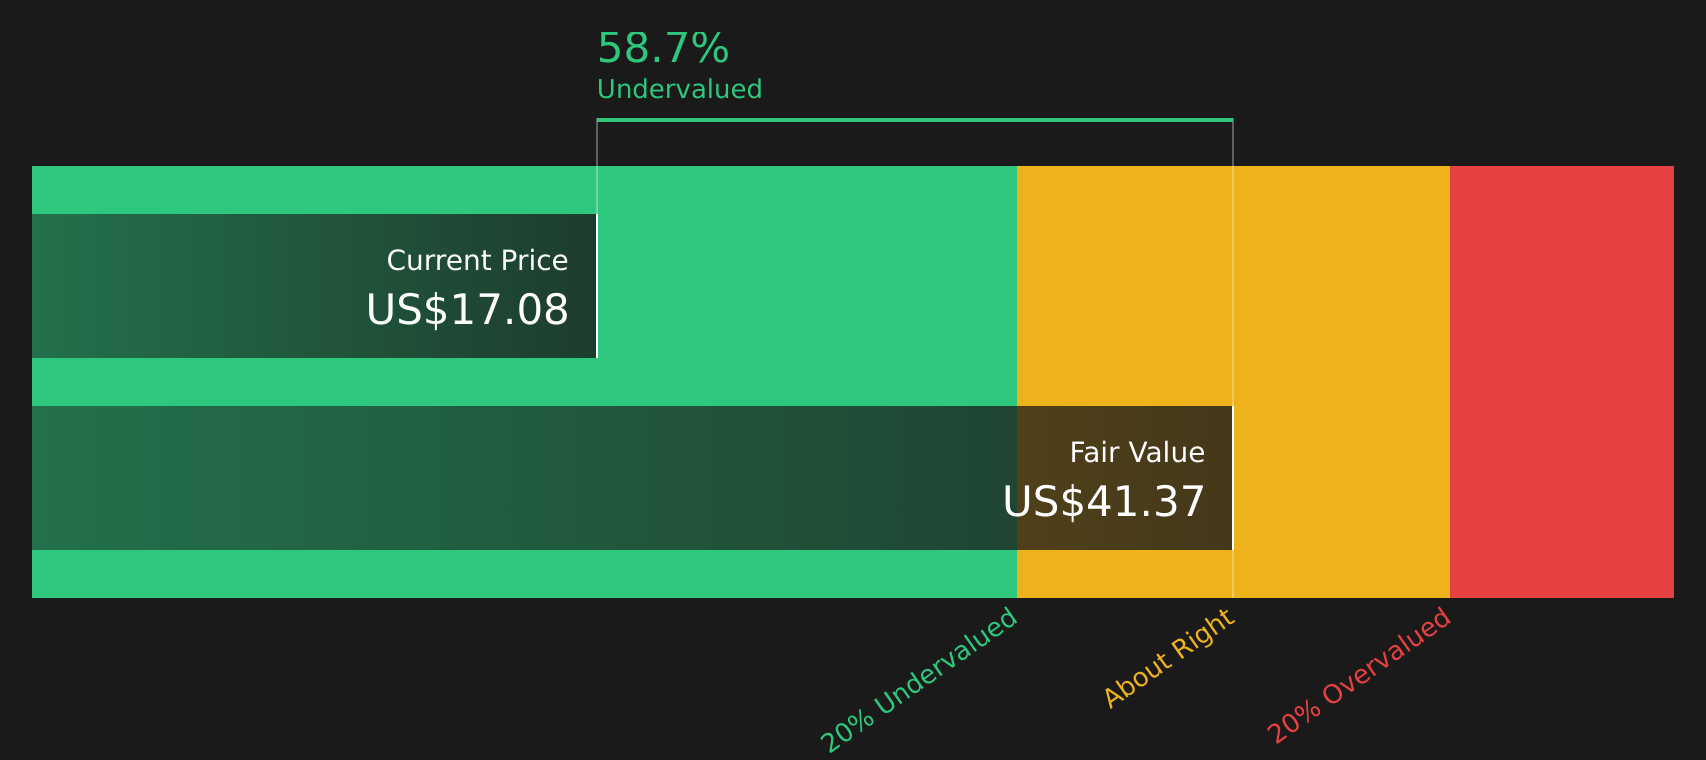
Pulling this together, the model arrives at an estimated intrinsic value of US$37.18 per share. Compared with the recent share price of US$15.52, this implies the stock is 58.3% undervalued based on these cash flow assumptions.
Result: UNDERVALUED
Our Discounted Cash Flow (DCF) analysis suggests Driven Brands Holdings is undervalued by 58.3%. Track this in your watchlist or portfolio, or discover 863 more undervalued stocks based on cash flows.
Approach 2: Driven Brands Holdings Price vs Sales
For companies where earnings can be uneven, the P/S ratio is a useful cross check because it compares the share price to the revenue the business is already generating, rather than to earnings that can be affected by non cash items or short term factors.
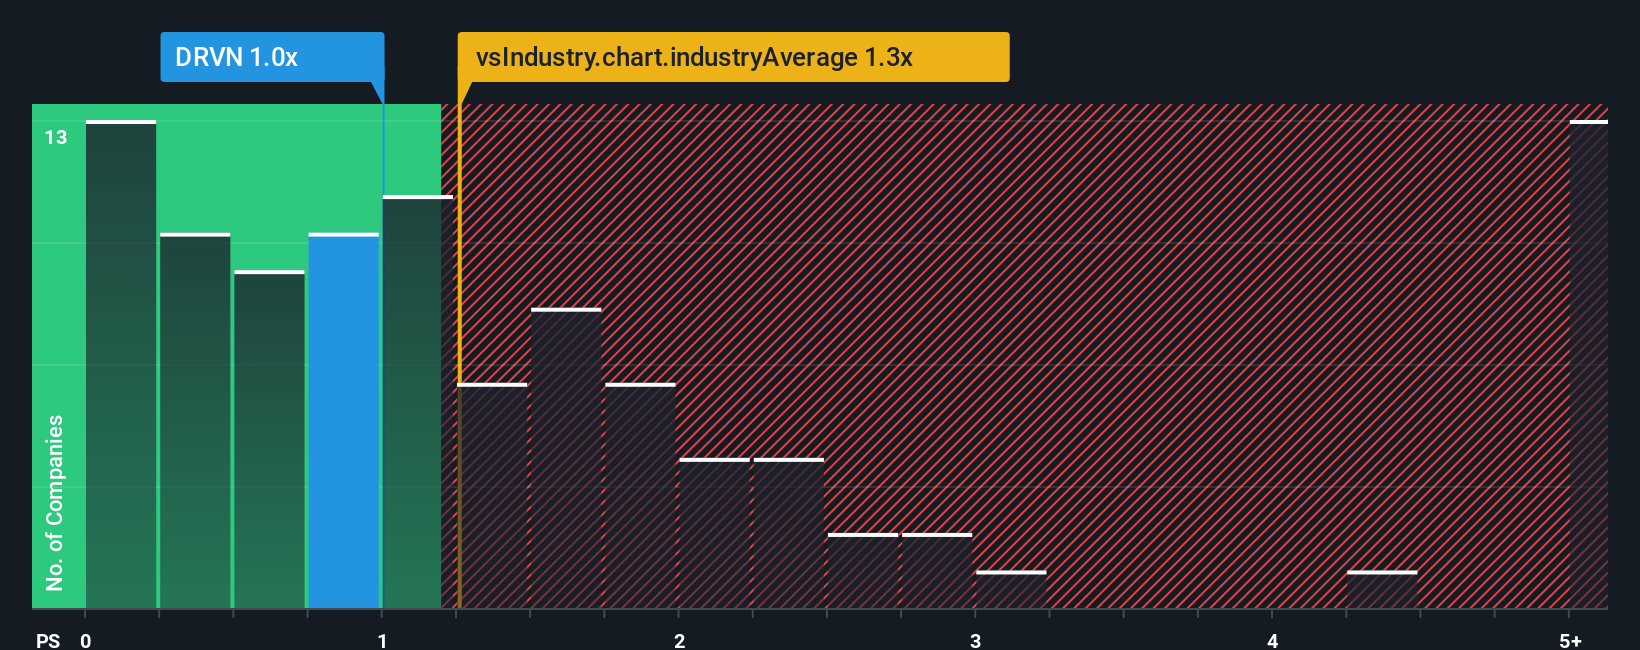
In general, higher growth expectations or lower perceived risk can justify a higher “normal” P/S ratio. In contrast, slower growth or higher risk tends to align with a lower multiple. For Driven Brands Holdings, the current P/S ratio is 1.05x. That sits below the Consumer Services industry average of 1.32x and the peer group average of 1.89x.
Simply Wall St’s Fair Ratio is its estimate of what a balanced P/S multiple should be for this company, at 0.99x, after factoring in elements such as growth outlook, profit margins, industry, market cap and company specific risks. Because it is tailored to the company, this Fair Ratio can be more informative than a simple comparison to broad industry or peer averages. With the actual P/S at 1.05x versus a Fair Ratio of 0.99x, the shares screen slightly expensive on this metric.
Result: OVERVALUED
P/S ratios tell one story, but what if the real opportunity lies elsewhere? Discover 1445 companies where insiders are betting big on explosive growth.
Upgrade Your Decision Making: Choose your Driven Brands Holdings Narrative
Earlier we mentioned that there is an even better way to understand valuation. Narratives on Simply Wall St let you attach your own story about Driven Brands Holdings to the numbers by linking what you think is happening in the business to a financial forecast, a fair value, and a clear comparison against the current price. All of this sits within an easy tool on the Community page that updates automatically when fresh news or earnings arrive. One investor might back a higher fair value closer to US$25 because they focus on store growth, recurring demand and profit margins. Another might anchor nearer US$18 because they are more focused on risks like EV adoption and competition. You can see those different Narratives side by side and decide which set of assumptions you feel most comfortable using for your own buy or sell decisions.
Do you think there's more to the story for Driven Brands Holdings? Head over to our Community to see what others are saying!
This article by Simply Wall St is general in nature. We provide commentary based on historical data and analyst forecasts only using an unbiased methodology and our articles are not intended to be financial advice. It does not constitute a recommendation to buy or sell any stock, and does not take account of your objectives, or your financial situation. We aim to bring you long-term focused analysis driven by fundamental data. Note that our analysis may not factor in the latest price-sensitive company announcements or qualitative material. Simply Wall St has no position in any stocks mentioned.