Is Emerson Electric (EMR) Still Fairly Priced After Strong Multi‑Year Share Gains?
Emerson Electric Co. EMR | 0.00 |
- If you are wondering whether Emerson Electric at around US$138 per share still offers value, it helps to step back and look at what the recent share price is actually telling you.
- The stock has been relatively steady over the last week, while posting returns of 5.1% over 30 days, 1.9% year to date and 31.1% over the past year, with longer term returns of 75.1% over three years and 60.8% over five years.
- Recent coverage has focused more on Emerson Electric's positioning within industrial automation and process control, as well as its role in broader power and infrastructure trends, which has kept investor attention on the stock. These themes help frame why the market has continued to reassess the risk and reward profile over the last few years.
- Emerson Electric currently has a value score of 3 out of 6. The next step is to walk through what different valuation methods say about the stock today, and then finish with a more complete way to think about valuation that pulls everything together.
Approach 1: Emerson Electric Discounted Cash Flow (DCF) Analysis
A Discounted Cash Flow, or DCF, model takes estimates of the cash Emerson Electric could generate in the future and discounts those back to today using a required rate of return. The idea is to work out what the entire stream of future cash flows is worth in today's dollars.
Emerson Electric's last twelve months Free Cash Flow is about $2.58b. Analysts have provided forecasts that feed into a 2 stage Free Cash Flow to Equity model, which then extends these views using Simply Wall St's own extrapolations. Under this approach, projected Free Cash Flow in 2030 is $4.93b, with intermediate annual figures between 2026 and 2035 provided or estimated to build a full 10 year path.
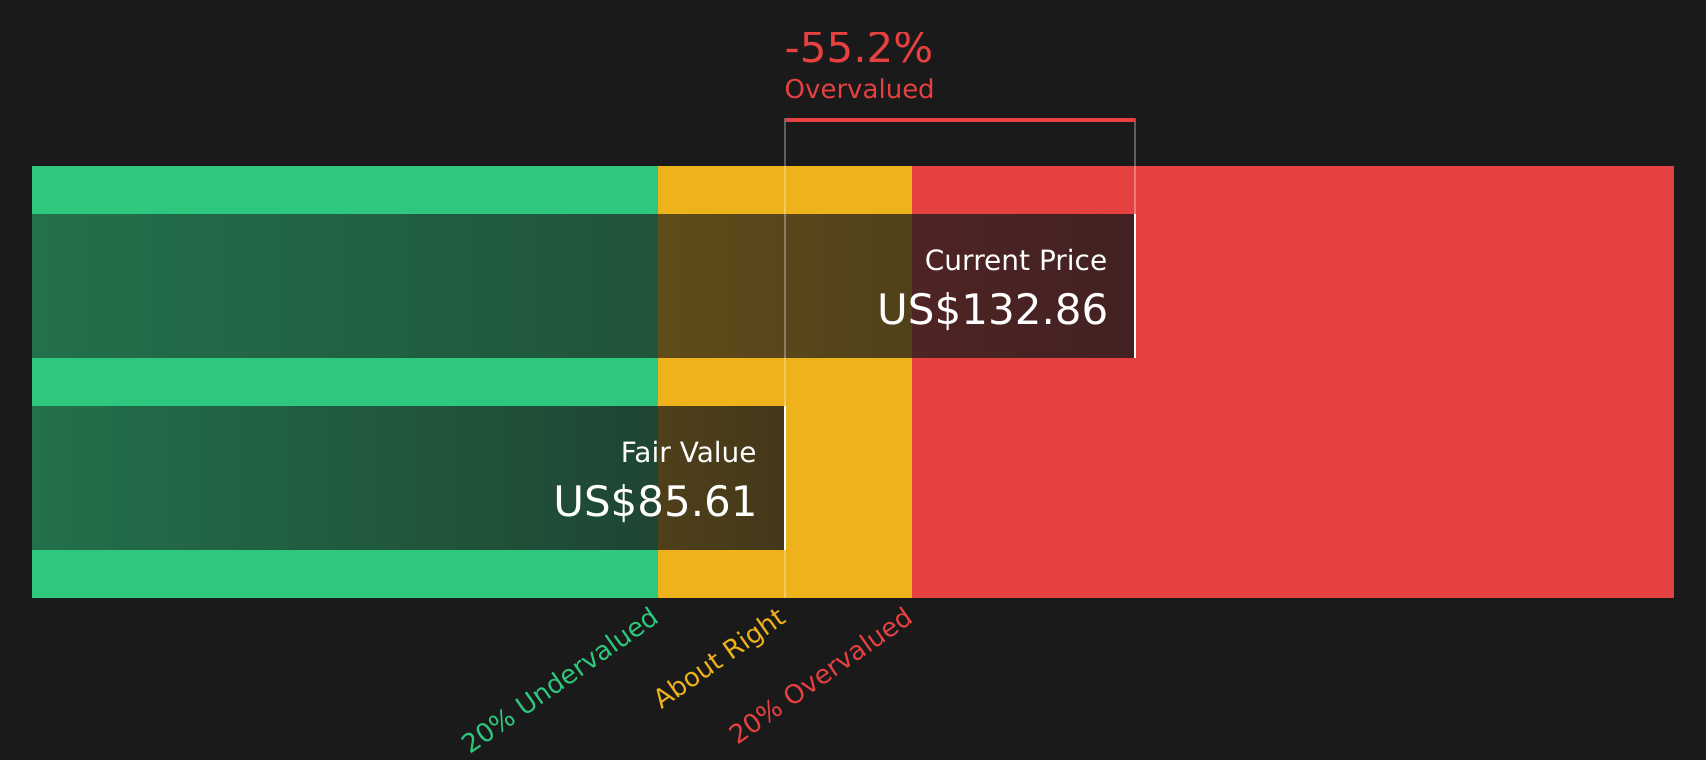
When all of those projected cash flows are discounted back, the model arrives at an intrinsic value of about $84.90 per share. Compared with the recent share price of around $138, the DCF output suggests the stock is about 63.0% overvalued on these assumptions.
Result: OVERVALUED
Our Discounted Cash Flow (DCF) analysis suggests Emerson Electric may be overvalued by 63.0%. Discover 51 high quality undervalued stocks or create your own screener to find better value opportunities.
Approach 2: Emerson Electric Price vs Earnings
For a profitable company, the P/E ratio is a useful shorthand for what investors are currently willing to pay for each dollar of earnings. Higher growth expectations and lower perceived risk usually support a higher, or more generous, P/E ratio, while slower growth or higher risk tends to be associated with a lower, or more cautious, multiple.
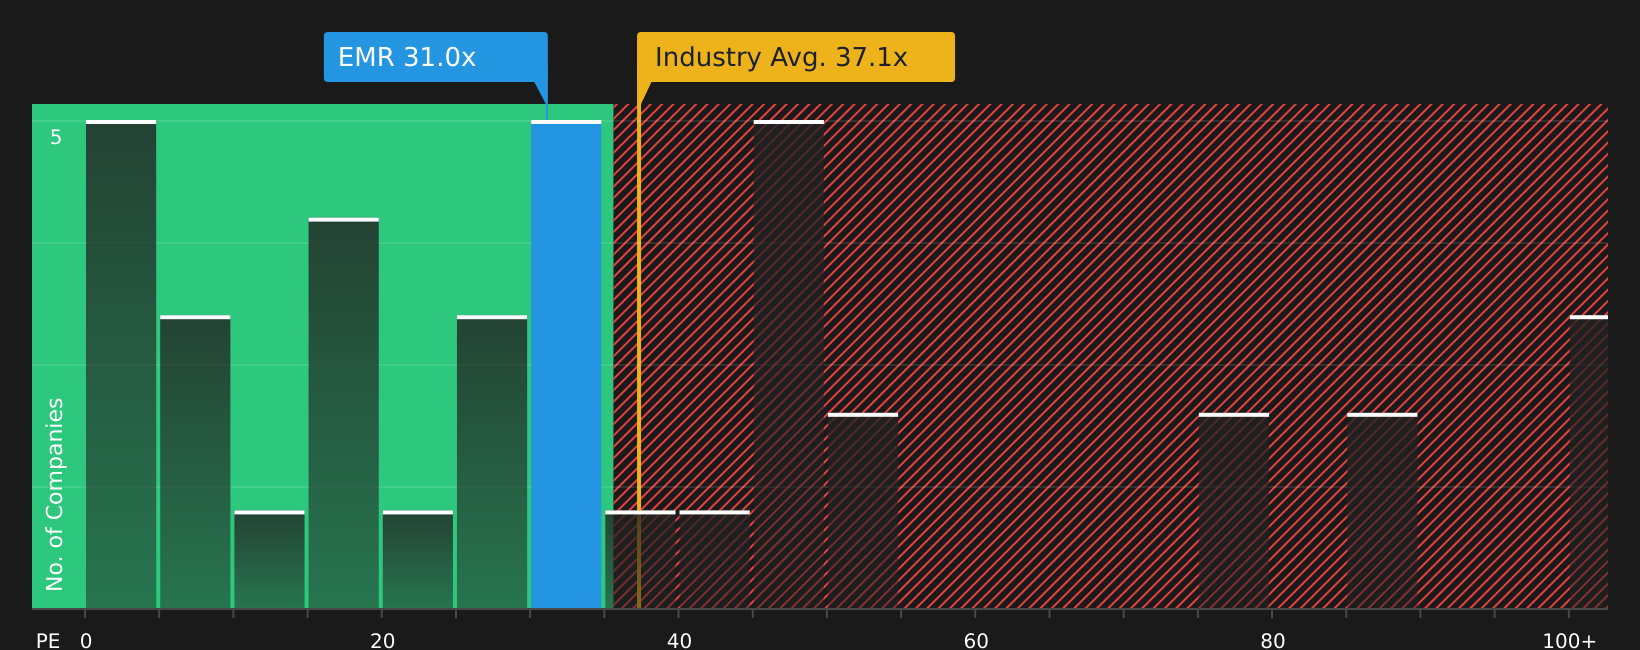
Emerson Electric is trading on a P/E of 33.74x, compared with the Electrical industry average of about 37.18x and a peer group average of 51.95x. Simply Wall St's Fair Ratio for Emerson Electric is 34.95x. This Fair Ratio is a proprietary estimate of what a more typical P/E might be for the stock, based on factors such as earnings growth profile, profit margins, industry, market capitalization and specific risks.
Looking at the Fair Ratio instead of just peers or the broad industry helps you anchor expectations to the characteristics of Emerson Electric itself. This avoids assuming it should trade at the same multiple as other companies that may have different growth, risk or profitability. With the current P/E of 33.74x sitting modestly below the Fair Ratio of 34.95x, the multiple indicates that Emerson Electric appears slightly undervalued on this measure.
Result: UNDERVALUED
P/E ratios tell one story, but what if the real opportunity lies elsewhere? Start investing in legacies, not executives. Discover our 19 top founder-led companies.
Upgrade Your Decision Making: Choose your Emerson Electric Narrative
Earlier it was mentioned that there is an even better way to understand valuation. Narratives on Simply Wall St let you attach a clear story about Emerson Electric, such as AI driven automation upside or margin and order risk, to specific forecasts for future revenue, earnings and margins. They then translate those assumptions into a Fair Value that is updated automatically as new news or earnings arrive, and then compare that Fair Value with the current share price to decide whether the stock looks more like the higher US$205 view or the lower US$120.65 view for you personally.
For Emerson Electric, we have made it easy to compare two leading Emerson Electric Narratives:
These sit on opposite sides of the fair value debate so you can quickly see which set of assumptions lines up better with your own view on growth, margins and risk.
Fair Value: US$205.00
Implied discount vs recent price: around 32.5% undervalued
Revenue growth assumption: 7.36% a year
- Leans on faster revenue and margin expansion tied to AspenTech synergies, AI enabled automation and strong power grid and electrification demand.
- Assumes Emerson shifts further toward higher growth, higher software and SaaS exposure, lifting recurring revenue and smoothing cycles.
- Flags real execution and competition risks, especially around legacy energy exposure and AI driven disruption, but views these as manageable within a higher earnings and P/E outcome.
Fair Value: US$120.65
Implied premium vs recent price: around 14.6% overvalued
Revenue growth assumption: 5.52% a year
- Focuses on pressure from protectionism, integration hurdles and the shift toward more open and digital automation that could challenge hardware margins.
- Builds in more moderate revenue growth and profitability, with a lower future P/E multiple to reflect competition, order visibility and macro sensitivity.
- Acknowledges long term drivers like automation and energy transition, but treats today’s valuation as already pricing in a lot of the upside.
Both narratives use detailed cash flow, margin and multiple assumptions rather than headlines. This is why they are useful anchors when you are testing your own view of what Emerson Electric is worth and how much risk you are comfortable taking on at around US$138 per share.
If you want to go beyond these headlines and see how other investors are framing the same set of facts, it is worth reviewing the wider range of community narratives as well as the latest company report and valuation work.
To see how these results tie into long-term growth, risks, and valuation, check out the full range of community narratives for Emerson Electric on Simply Wall St. Add the company to your watchlist or portfolio so you'll be alerted when the story evolves.
Do you think there's more to the story for Emerson Electric? Head over to our Community to see what others are saying!

This article by Simply Wall St is general in nature. We provide commentary based on historical data and analyst forecasts only using an unbiased methodology and our articles are not intended to be financial advice. It does not constitute a recommendation to buy or sell any stock, and does not take account of your objectives, or your financial situation. We aim to bring you long-term focused analysis driven by fundamental data. Note that our analysis may not factor in the latest price-sensitive company announcements or qualitative material. Simply Wall St has no position in any stocks mentioned.